Fig. 9.
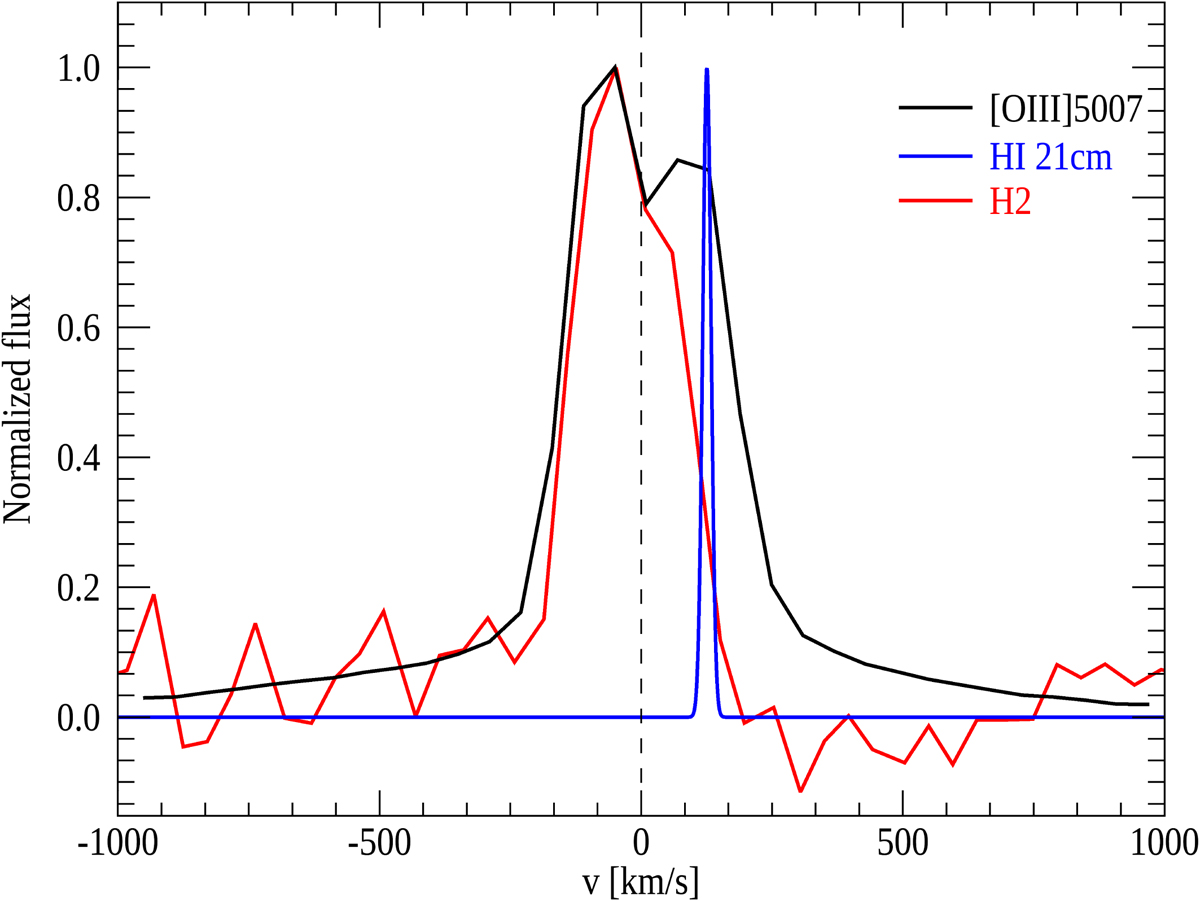
Normalized [O III]λ5007 Å line (solid black), stacked H2 line (solid red), and H I 21 cm line (solid blue) in velocity space. Each line is normalized with respect to its maximum value. The zero velocity along the x-axis is the systemic velocity of the galaxy as extracted in Sect. 3.1 and is marked with the black vertical dashed line. The H I line has been observed in absorption by Véron-Cetty et al. (2000) and is reproduced as an emission line using a Gaussian function and the parameters reported in the text.
Current usage metrics show cumulative count of Article Views (full-text article views including HTML views, PDF and ePub downloads, according to the available data) and Abstracts Views on Vision4Press platform.
Data correspond to usage on the plateform after 2015. The current usage metrics is available 48-96 hours after online publication and is updated daily on week days.
Initial download of the metrics may take a while.