Free Access
Fig. 8.
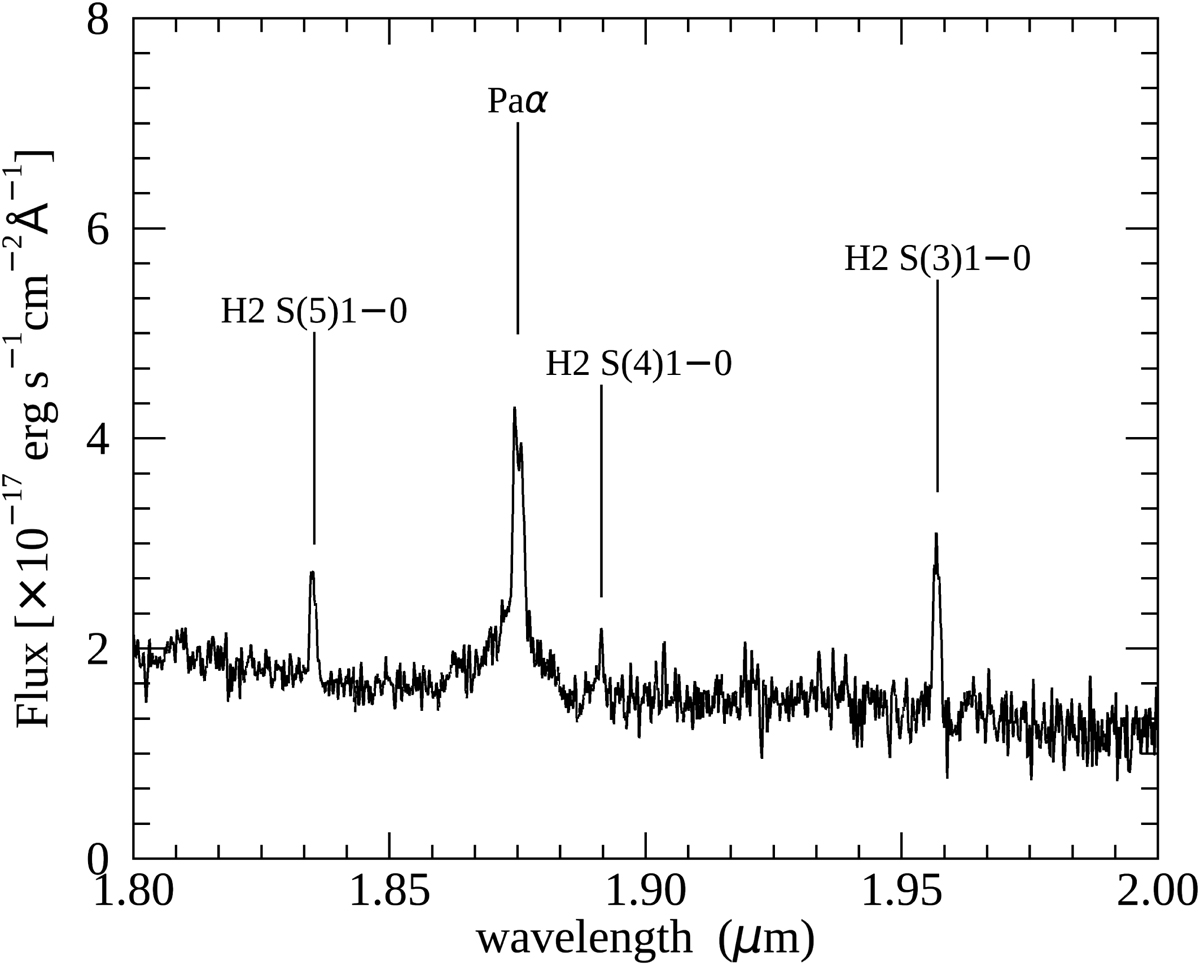
Section of the nuclear spectrum of PKS B1934-63 in the NIR band showing the warm molecular H2 emission lines and the Paα line. The wavelength and the name of each line are indicated.
Current usage metrics show cumulative count of Article Views (full-text article views including HTML views, PDF and ePub downloads, according to the available data) and Abstracts Views on Vision4Press platform.
Data correspond to usage on the plateform after 2015. The current usage metrics is available 48-96 hours after online publication and is updated daily on week days.
Initial download of the metrics may take a while.