Fig. 7.
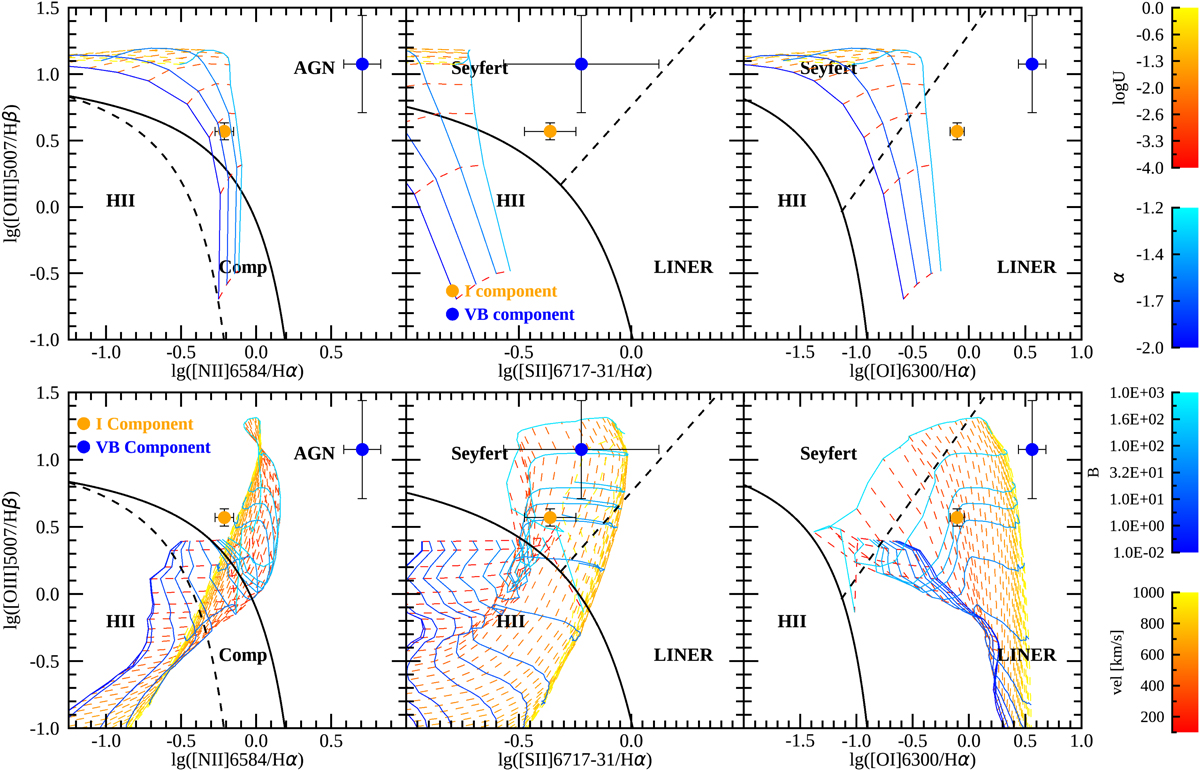
BPT diagrams for the intermediate and very broad components with models of AGN photoionization (upper panels) and shocks (lower panels) with solar metallicity. The AGN photionization models have a gas density ne = 105 cm−3, and the α and logU parameters vary in the same range as described in Fig. 6. The shock models have a pre-shock gas density of ne = 103 cm−3, the dashed lines indicate models with constant shock velocity vs (ranging in the interval 100–1000 km s−1, from left to right), and the solid lines refer to models with a constant magnetic parameter B (ranging in the interval 0.01–1000 μG, from bottom to top). The solid and dashed black lines are the same as in Fig. 6.
Current usage metrics show cumulative count of Article Views (full-text article views including HTML views, PDF and ePub downloads, according to the available data) and Abstracts Views on Vision4Press platform.
Data correspond to usage on the plateform after 2015. The current usage metrics is available 48-96 hours after online publication and is updated daily on week days.
Initial download of the metrics may take a while.