Fig. 6.
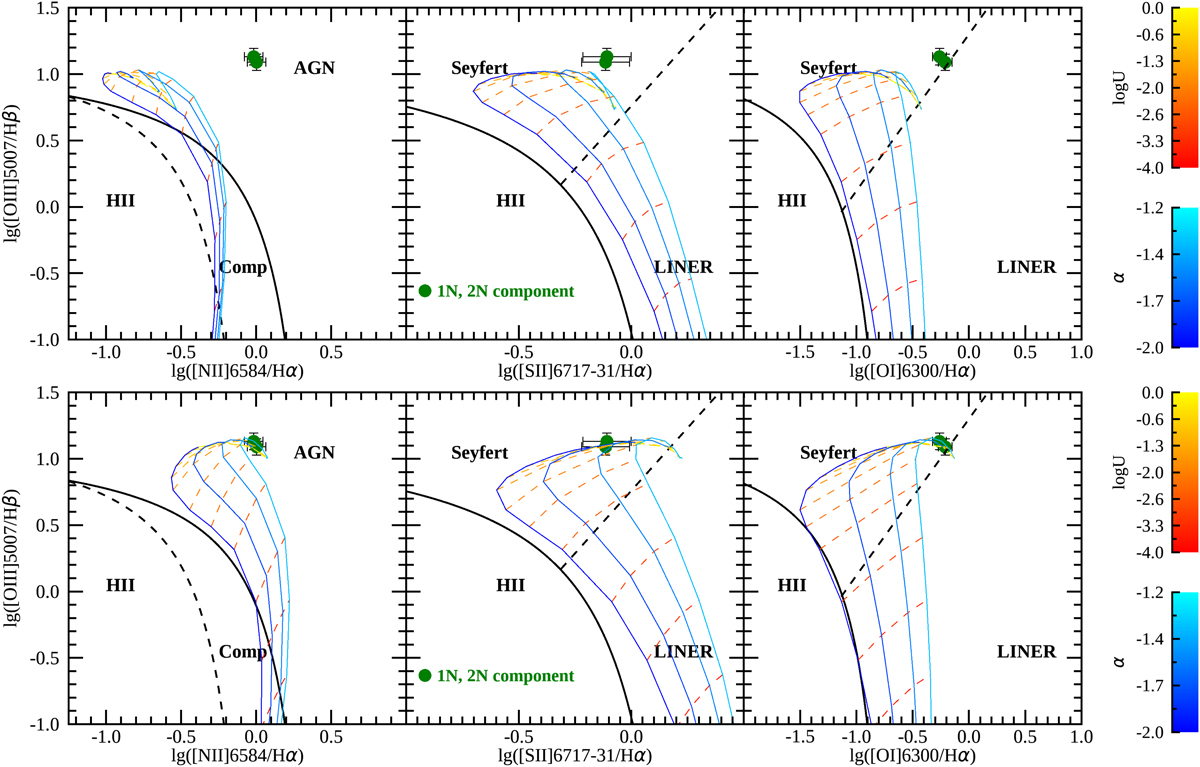
BPT diagrams for the two narrow components with models of AGN photoionization with solar metallicity (upper panels) and twice the solar metallicity (lower panels). The models have a gas density ne = 103 cm−3, the dashed lines indicate models with constant photoionization parameter logU (from −4 to 0, from bottom to top ), and the solid lines refer to models with constant spectral index α (from −2 to −1.2, from left to right). The solid line in all the panels is the Kewley et al. (2001) maximum starburst line. The dashed line in the left panels is the semi-empirical Kauffmann et al. (2003) line. The dashed line in the central and right panels is the empirical Kewley et al. (2006) line separating Seyfert galaxies from LINERS.
Current usage metrics show cumulative count of Article Views (full-text article views including HTML views, PDF and ePub downloads, according to the available data) and Abstracts Views on Vision4Press platform.
Data correspond to usage on the plateform after 2015. The current usage metrics is available 48-96 hours after online publication and is updated daily on week days.
Initial download of the metrics may take a while.