Fig. 5.
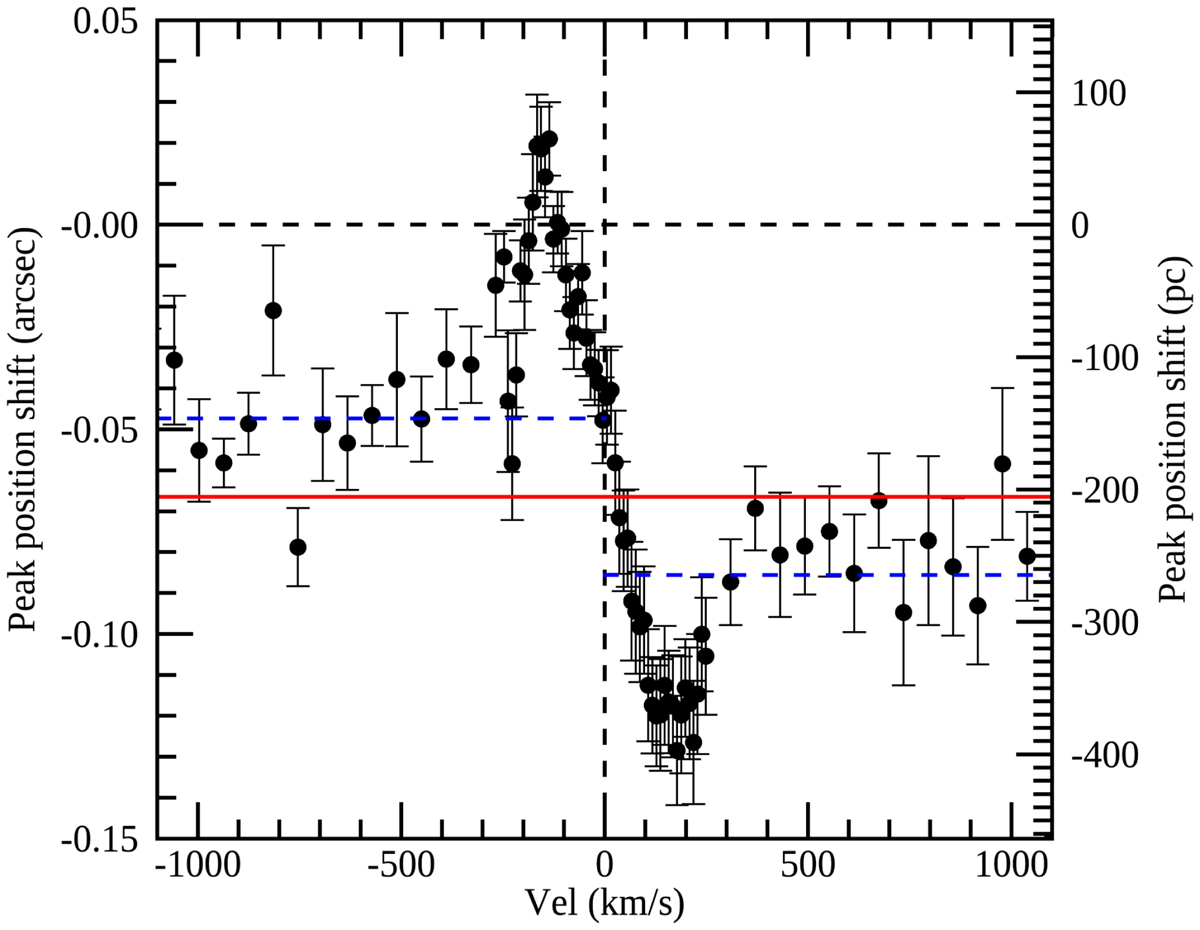
Fitted centers of the [O III]5007 Å emission line spatial profiles, measured in arcsec (left y-axis) and parsec (right y-axis), as a function of velocity. The black dashed vertical and horizontal lines mark the zero point of both axes. The blue dashed lines mark the error-weighted mean position of the [O III] spatial profiles at v < 250 km s−1 and at v > 250 km s−1, and the red solid line marks their average. The negative values along the y-axis indicate the direction pointing toward the companion galaxy to the west.
Current usage metrics show cumulative count of Article Views (full-text article views including HTML views, PDF and ePub downloads, according to the available data) and Abstracts Views on Vision4Press platform.
Data correspond to usage on the plateform after 2015. The current usage metrics is available 48-96 hours after online publication and is updated daily on week days.
Initial download of the metrics may take a while.