Fig. 4.
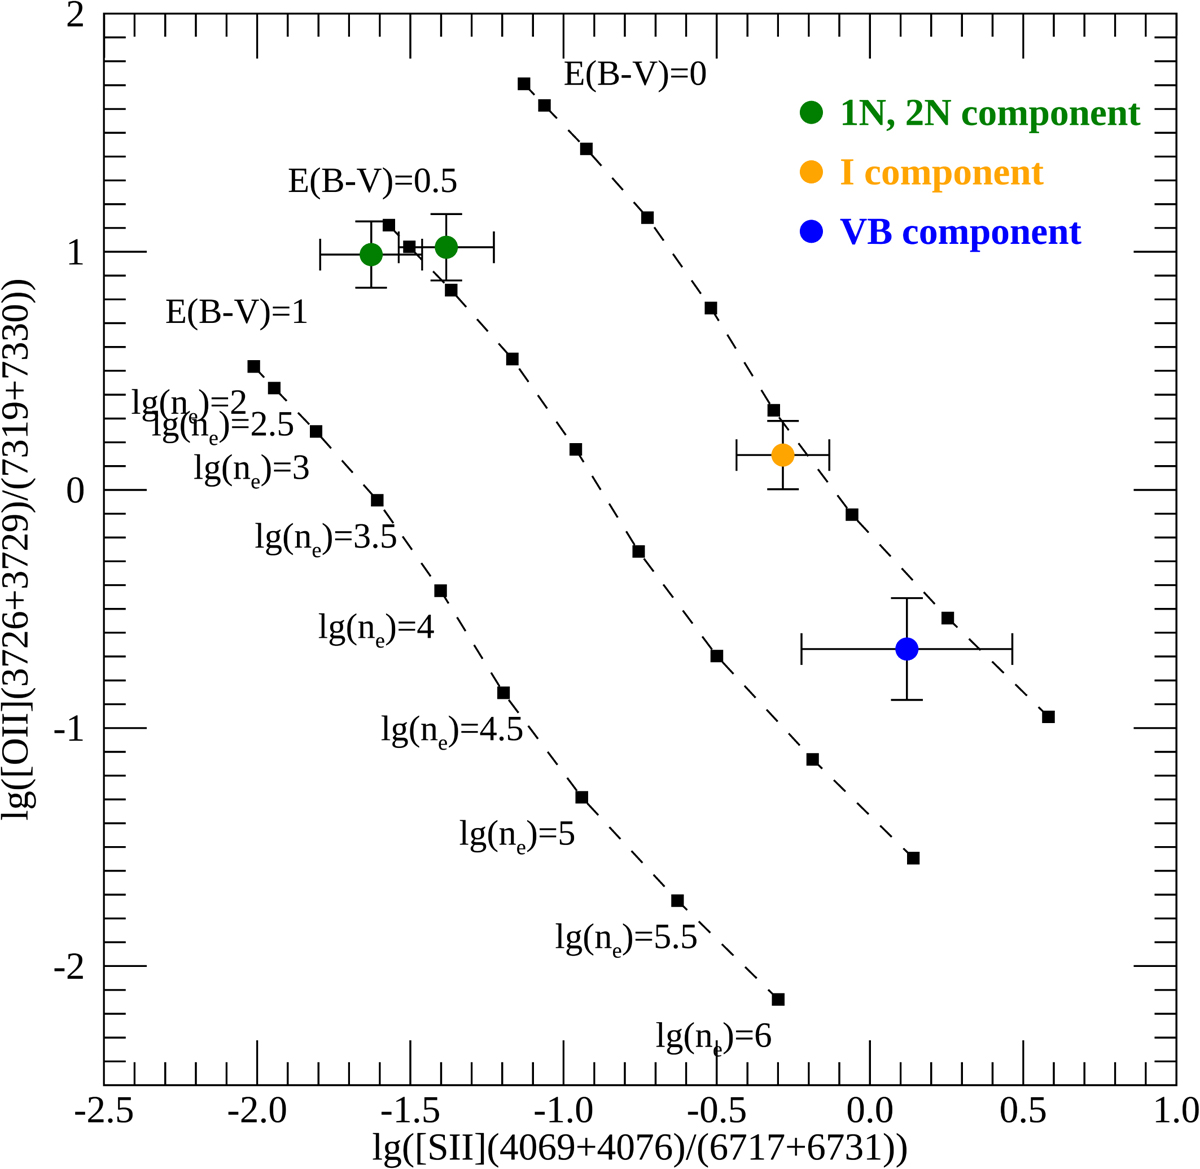
Density diagnostic diagram using the logarithm of the [O II] (3727+3729)/(7318+7319+7330+7331) and of the [S II] (4068+4076)/(6716+6731) line ratios. Each sequence of black squares, joined by the dashed black line, is a sequence of AGN photoionization models with constant power-law index (α = −1.5) and ionization parameter (U = 0.005), created by varying the electron density of the model in the interval ne = 100 − 106 cm−3 (from top left to bottom right) with a step Δlog10ne = 0.5. The three different sequences in the plot (from top right to bottom left) are associated with E(B−V) = 0, 0.5 and 1. Green circles represent the narrow components; the intermediate and very broad components are indicated by the golden and blue circle, respectively. Error bars for each point are estimated as described in the text.
Current usage metrics show cumulative count of Article Views (full-text article views including HTML views, PDF and ePub downloads, according to the available data) and Abstracts Views on Vision4Press platform.
Data correspond to usage on the plateform after 2015. The current usage metrics is available 48-96 hours after online publication and is updated daily on week days.
Initial download of the metrics may take a while.