Fig. 3.
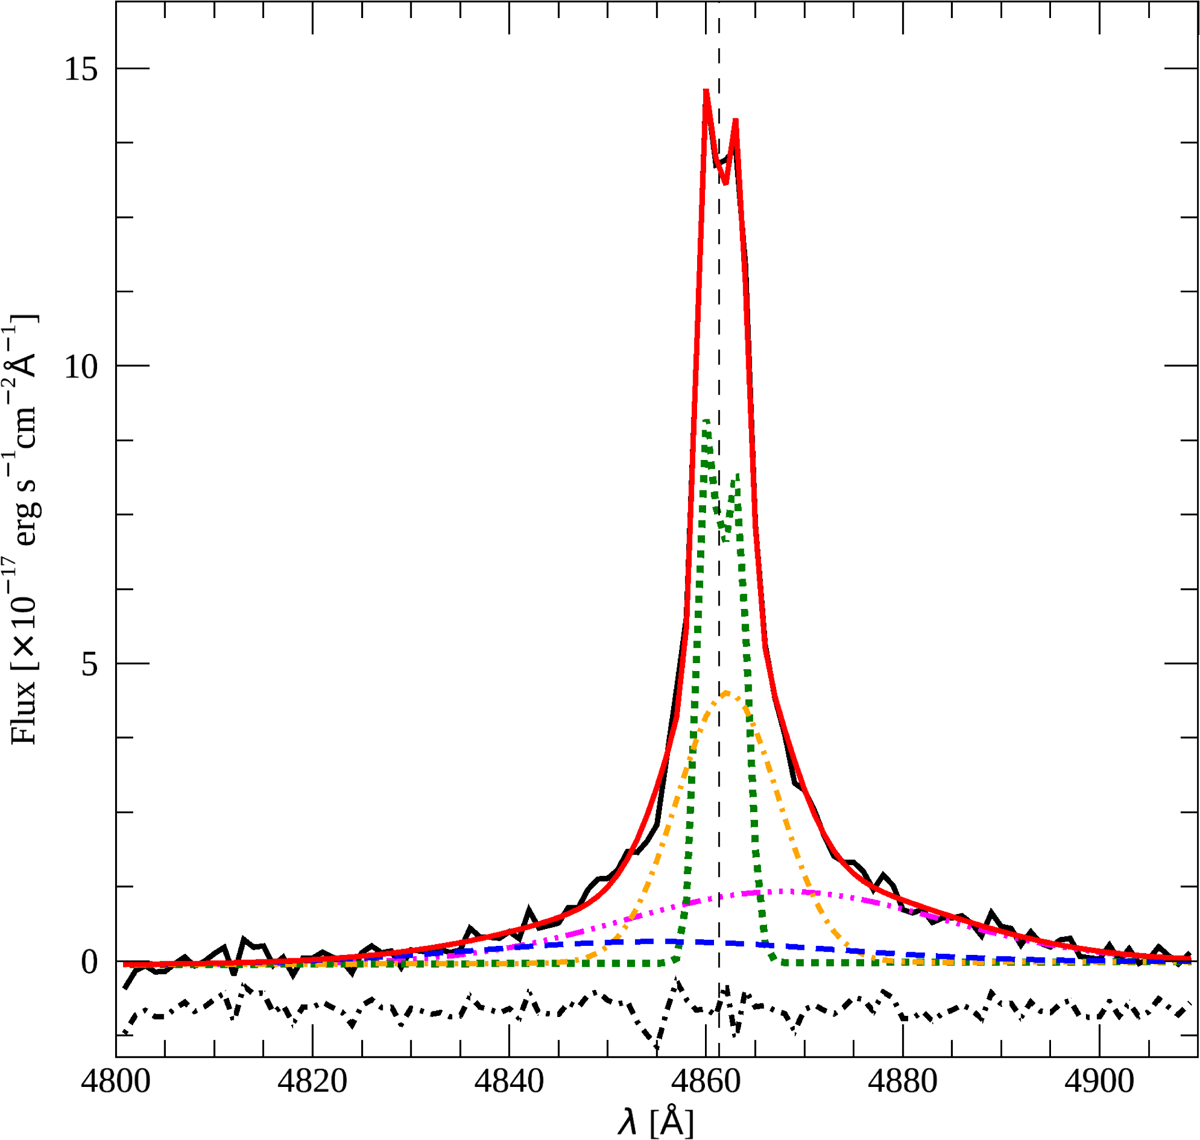
Hβ line (black solid line) and the Hβ model (red solid line). The Hβ model includes the four components of the [O III] model (see Fig. 2 for a description) and an additional broad redshifted component (magenta triple dot-dashed line). The residuals of the fit are normalized and plotted below the spectrum (black dot-dashed line). The vertical dashed lines marks the restframe wavelength of the emission line.
Current usage metrics show cumulative count of Article Views (full-text article views including HTML views, PDF and ePub downloads, according to the available data) and Abstracts Views on Vision4Press platform.
Data correspond to usage on the plateform after 2015. The current usage metrics is available 48-96 hours after online publication and is updated daily on week days.
Initial download of the metrics may take a while.