Fig. A.13.
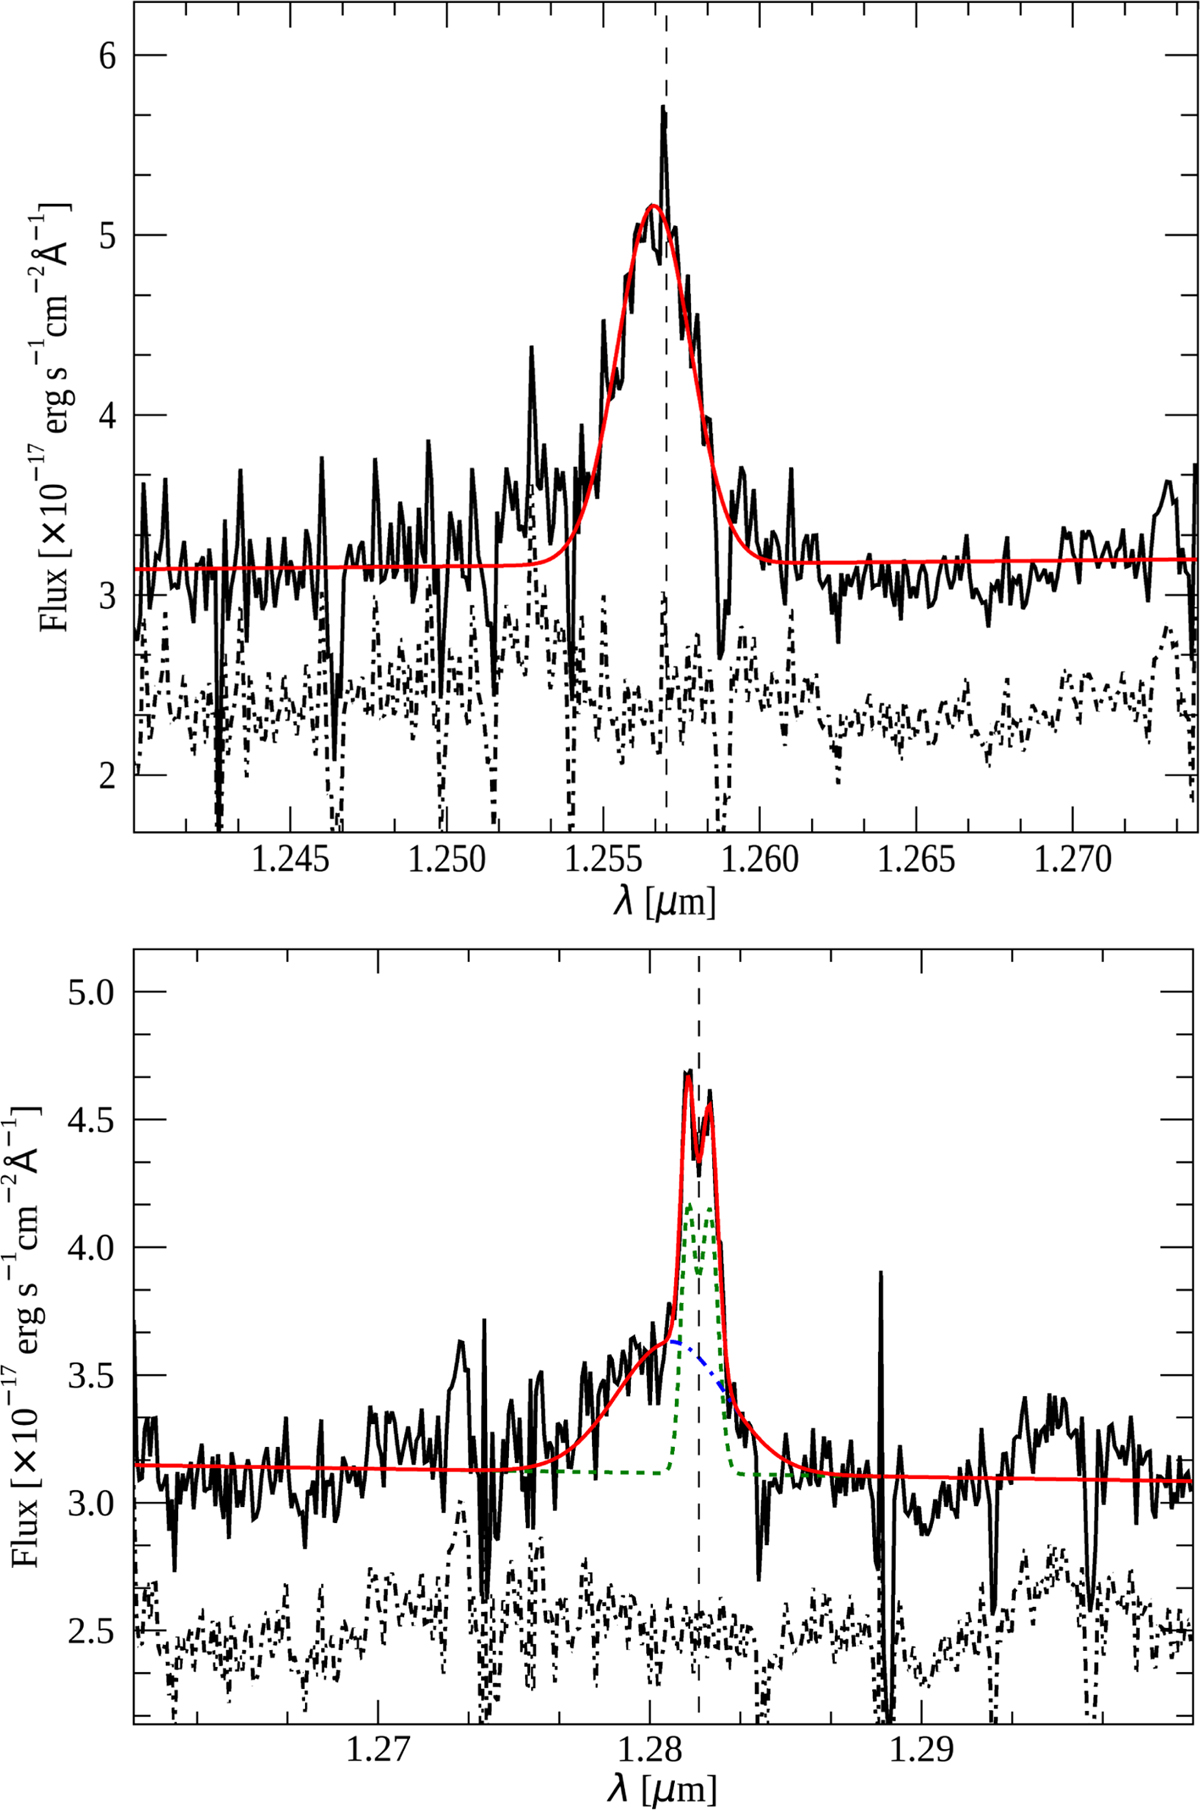
Section of the nuclear spectrum of PKS B1934-63 showing the Fe II 1.257 μm(top panel) and the Paβ (bottom panel) emission lines (black solid line). The best-fit model is shown with the red solid line. The residuals of the fit are normalized and plotted below the spectrum (black dot-dashed line). The vertical dashed lines mark the restframe wavelength of the emission line. For the Paβ, the model includes two narrow components (green dotted line) and a broad component (blue dashed line).
Current usage metrics show cumulative count of Article Views (full-text article views including HTML views, PDF and ePub downloads, according to the available data) and Abstracts Views on Vision4Press platform.
Data correspond to usage on the plateform after 2015. The current usage metrics is available 48-96 hours after online publication and is updated daily on week days.
Initial download of the metrics may take a while.