Fig. A.11.
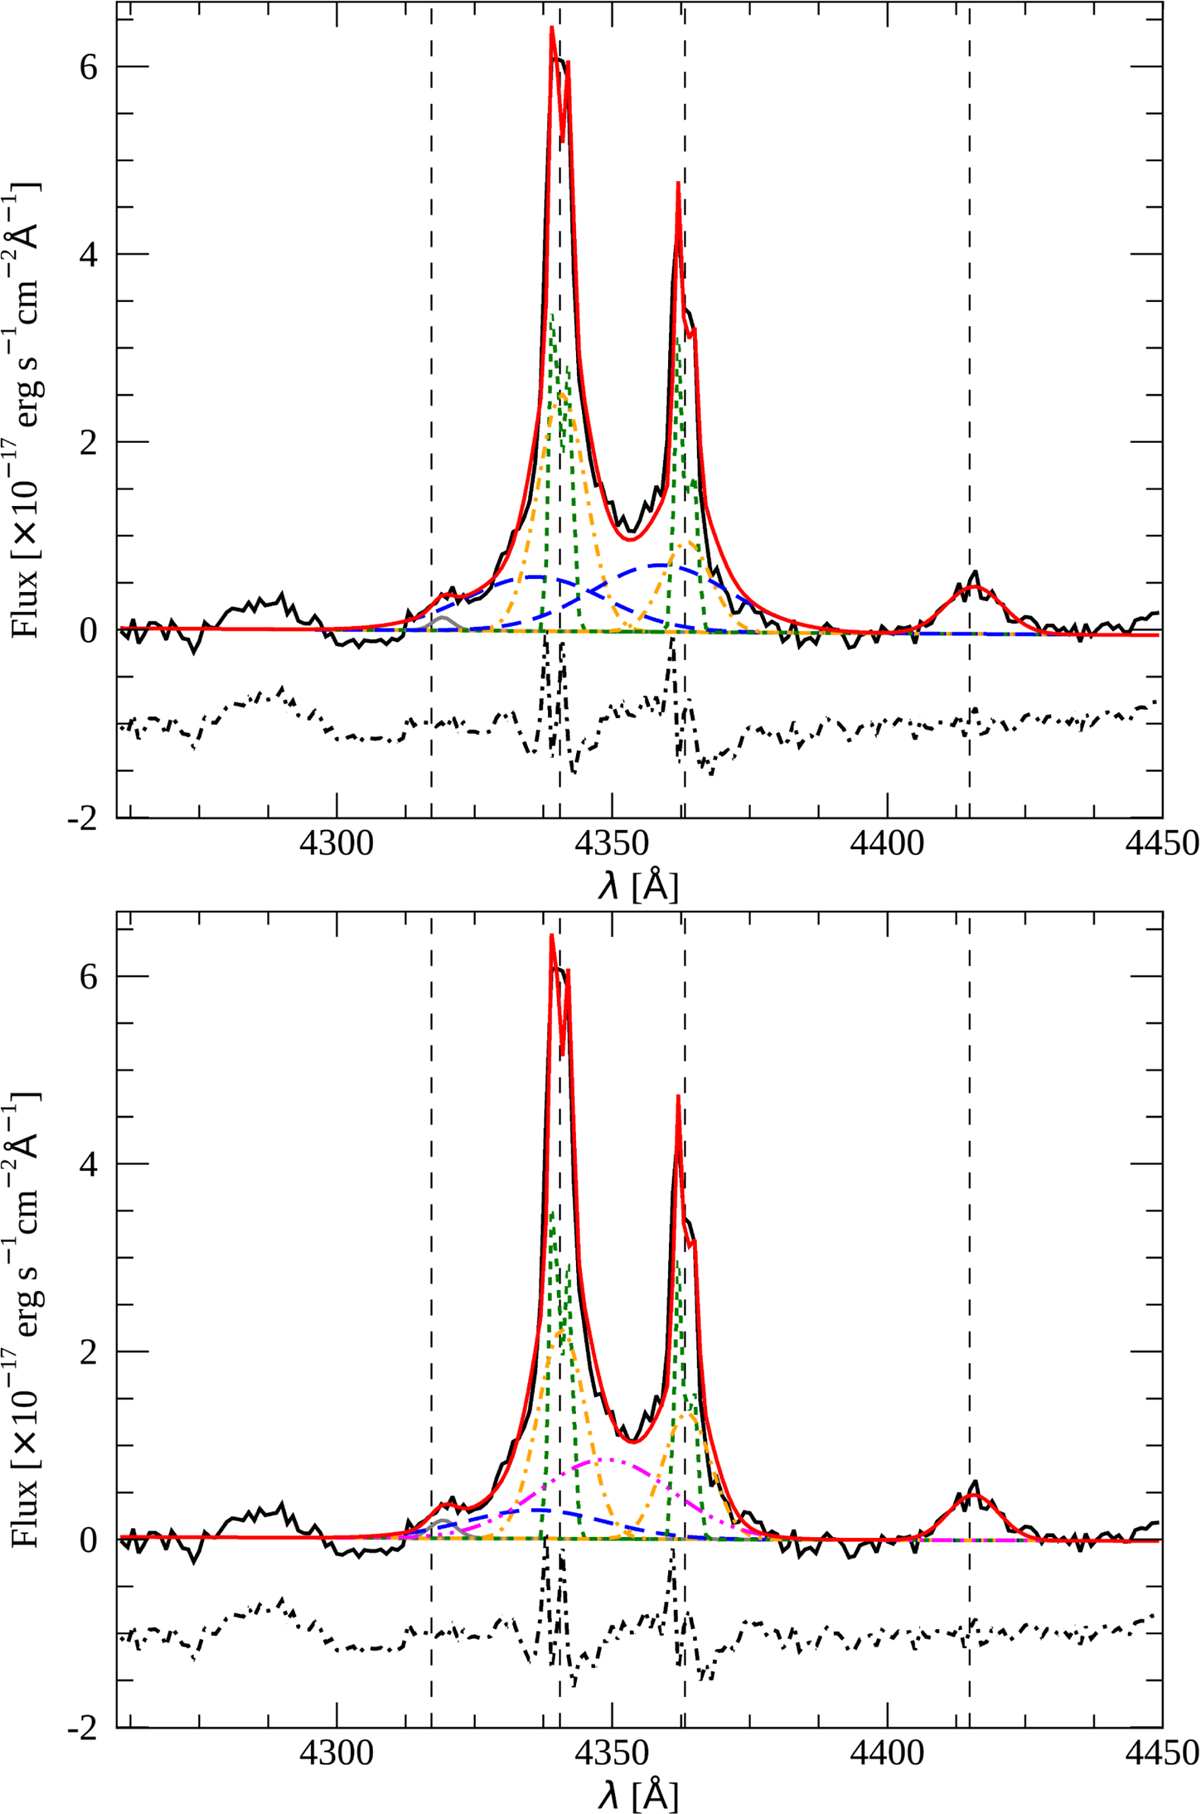
Hγ+[O III]λ4363 Å emission lines (black solid line) and best-fit model (red solid line). The fitting procedure includes the modeling of two additional emission lines (gray solid line), most likely the [O II]λ4317.2 Å and the [O II]λ4414.9 Å lines, using a single Gaussian function. The residuals of the fit are normalized and plotted below the spectrum (black dot-dashed line). The vertical dashed lines mark the restframe wavelength of the fitted emission lines. The [O III]λ4363 Å line is modeled using the [O III] model, and the Hγ line is modeled using both the [O III] model (top panel) and the Hβ model (bottom panel). The 1N and 2N components are plotted together with the green dotted line, the I component is shown with the golden dot-dashed line, and the VB component with the blue dashed line. The magenta triple dot-dashed line indicates the broad redshifted component of the Hβ model.
Current usage metrics show cumulative count of Article Views (full-text article views including HTML views, PDF and ePub downloads, according to the available data) and Abstracts Views on Vision4Press platform.
Data correspond to usage on the plateform after 2015. The current usage metrics is available 48-96 hours after online publication and is updated daily on week days.
Initial download of the metrics may take a while.