Fig. 2.
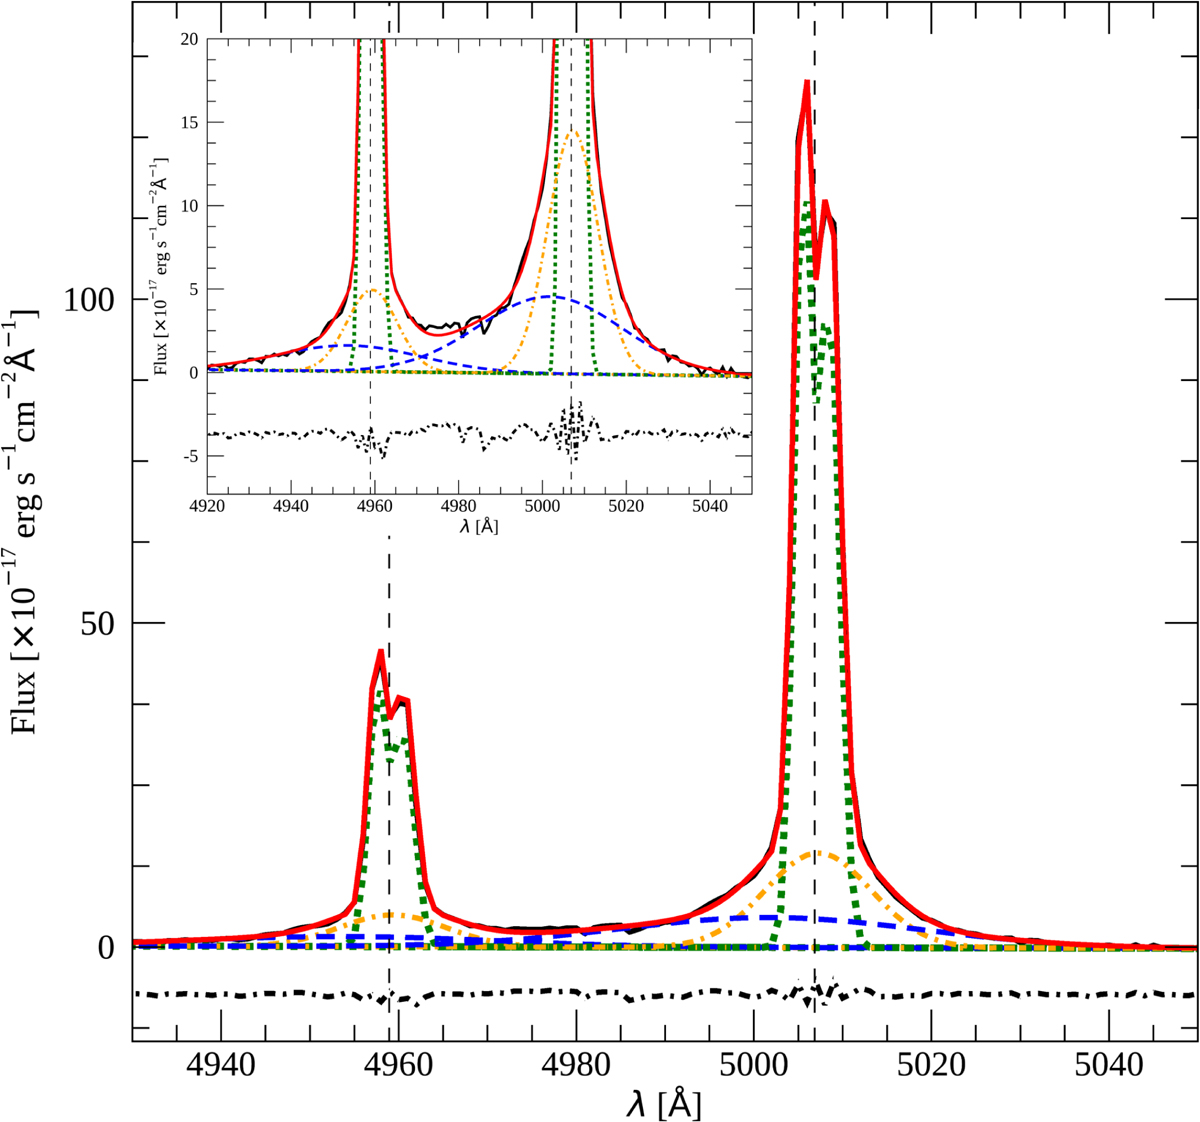
[O III]λλ4958,5007 Å doublet (black solid line) and the [O III] model (red solid line). The [O III] model includes two narrow components (1N and 2N component, green dotted line), one intermediate component (I component, yellow dot-dashed line), and one very broad component (VB component, blue dashed line). The residuals of the fit are normalized and plotted below the spectrum (black dot-dashed line). The vertical dashed line marks the restframe wavelength of the emission lines. The inset in the top left part of the plot shows a zoom-in of the I and VB components.
Current usage metrics show cumulative count of Article Views (full-text article views including HTML views, PDF and ePub downloads, according to the available data) and Abstracts Views on Vision4Press platform.
Data correspond to usage on the plateform after 2015. The current usage metrics is available 48-96 hours after online publication and is updated daily on week days.
Initial download of the metrics may take a while.