Free Access
Fig. A.1.
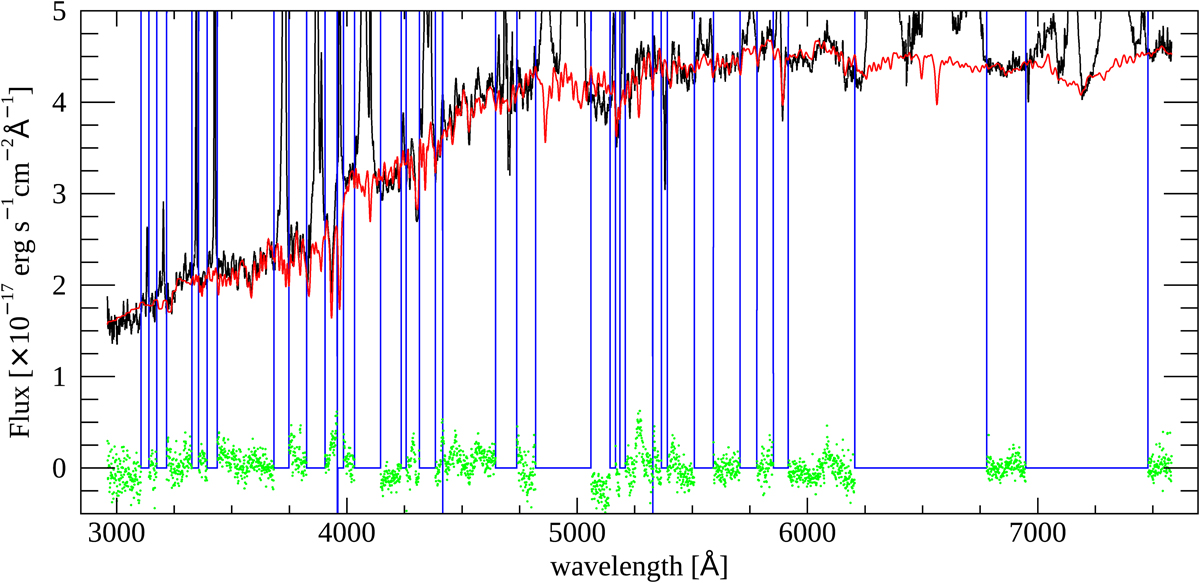
Nuclear spectrum (black solid line) and best-fit model (red solid line) for the continuum emission and residual (green points). The masked regions that correspond to the emission lines are indicated in blue. The observed spectrum is smoothed with a box of 3 Å.
Current usage metrics show cumulative count of Article Views (full-text article views including HTML views, PDF and ePub downloads, according to the available data) and Abstracts Views on Vision4Press platform.
Data correspond to usage on the plateform after 2015. The current usage metrics is available 48-96 hours after online publication and is updated daily on week days.
Initial download of the metrics may take a while.