Free Access
Fig. 1.
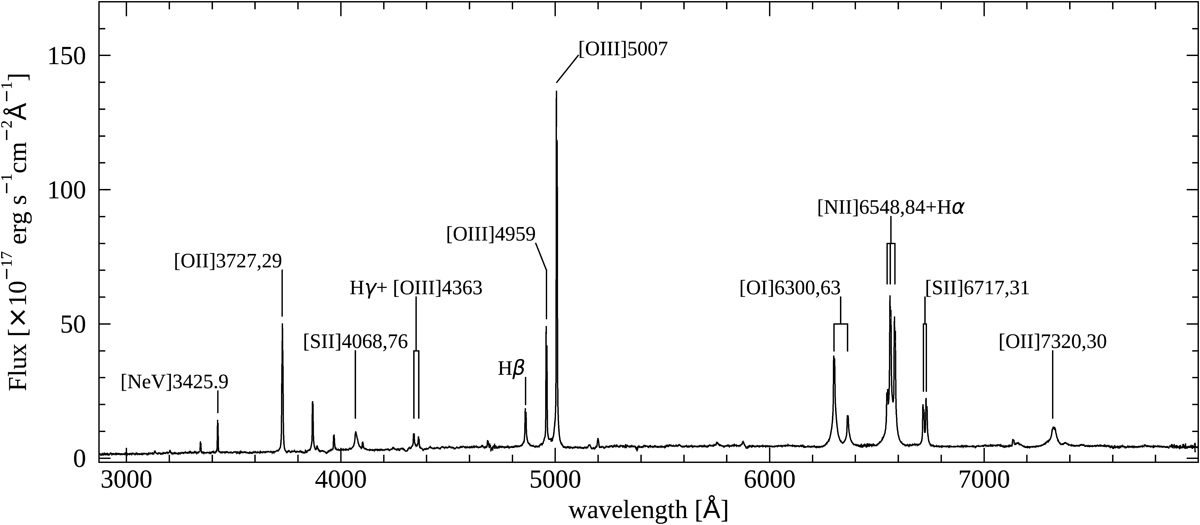
UVB+VIS nuclear spectrum of PKS B1934-63. The main emission lines are indicated. Wavelengths are plotted in Å, and the flux scale is given in units of 10−17 erg s−1 cm−2 Å−1.
Current usage metrics show cumulative count of Article Views (full-text article views including HTML views, PDF and ePub downloads, according to the available data) and Abstracts Views on Vision4Press platform.
Data correspond to usage on the plateform after 2015. The current usage metrics is available 48-96 hours after online publication and is updated daily on week days.
Initial download of the metrics may take a while.