Fig. 9.
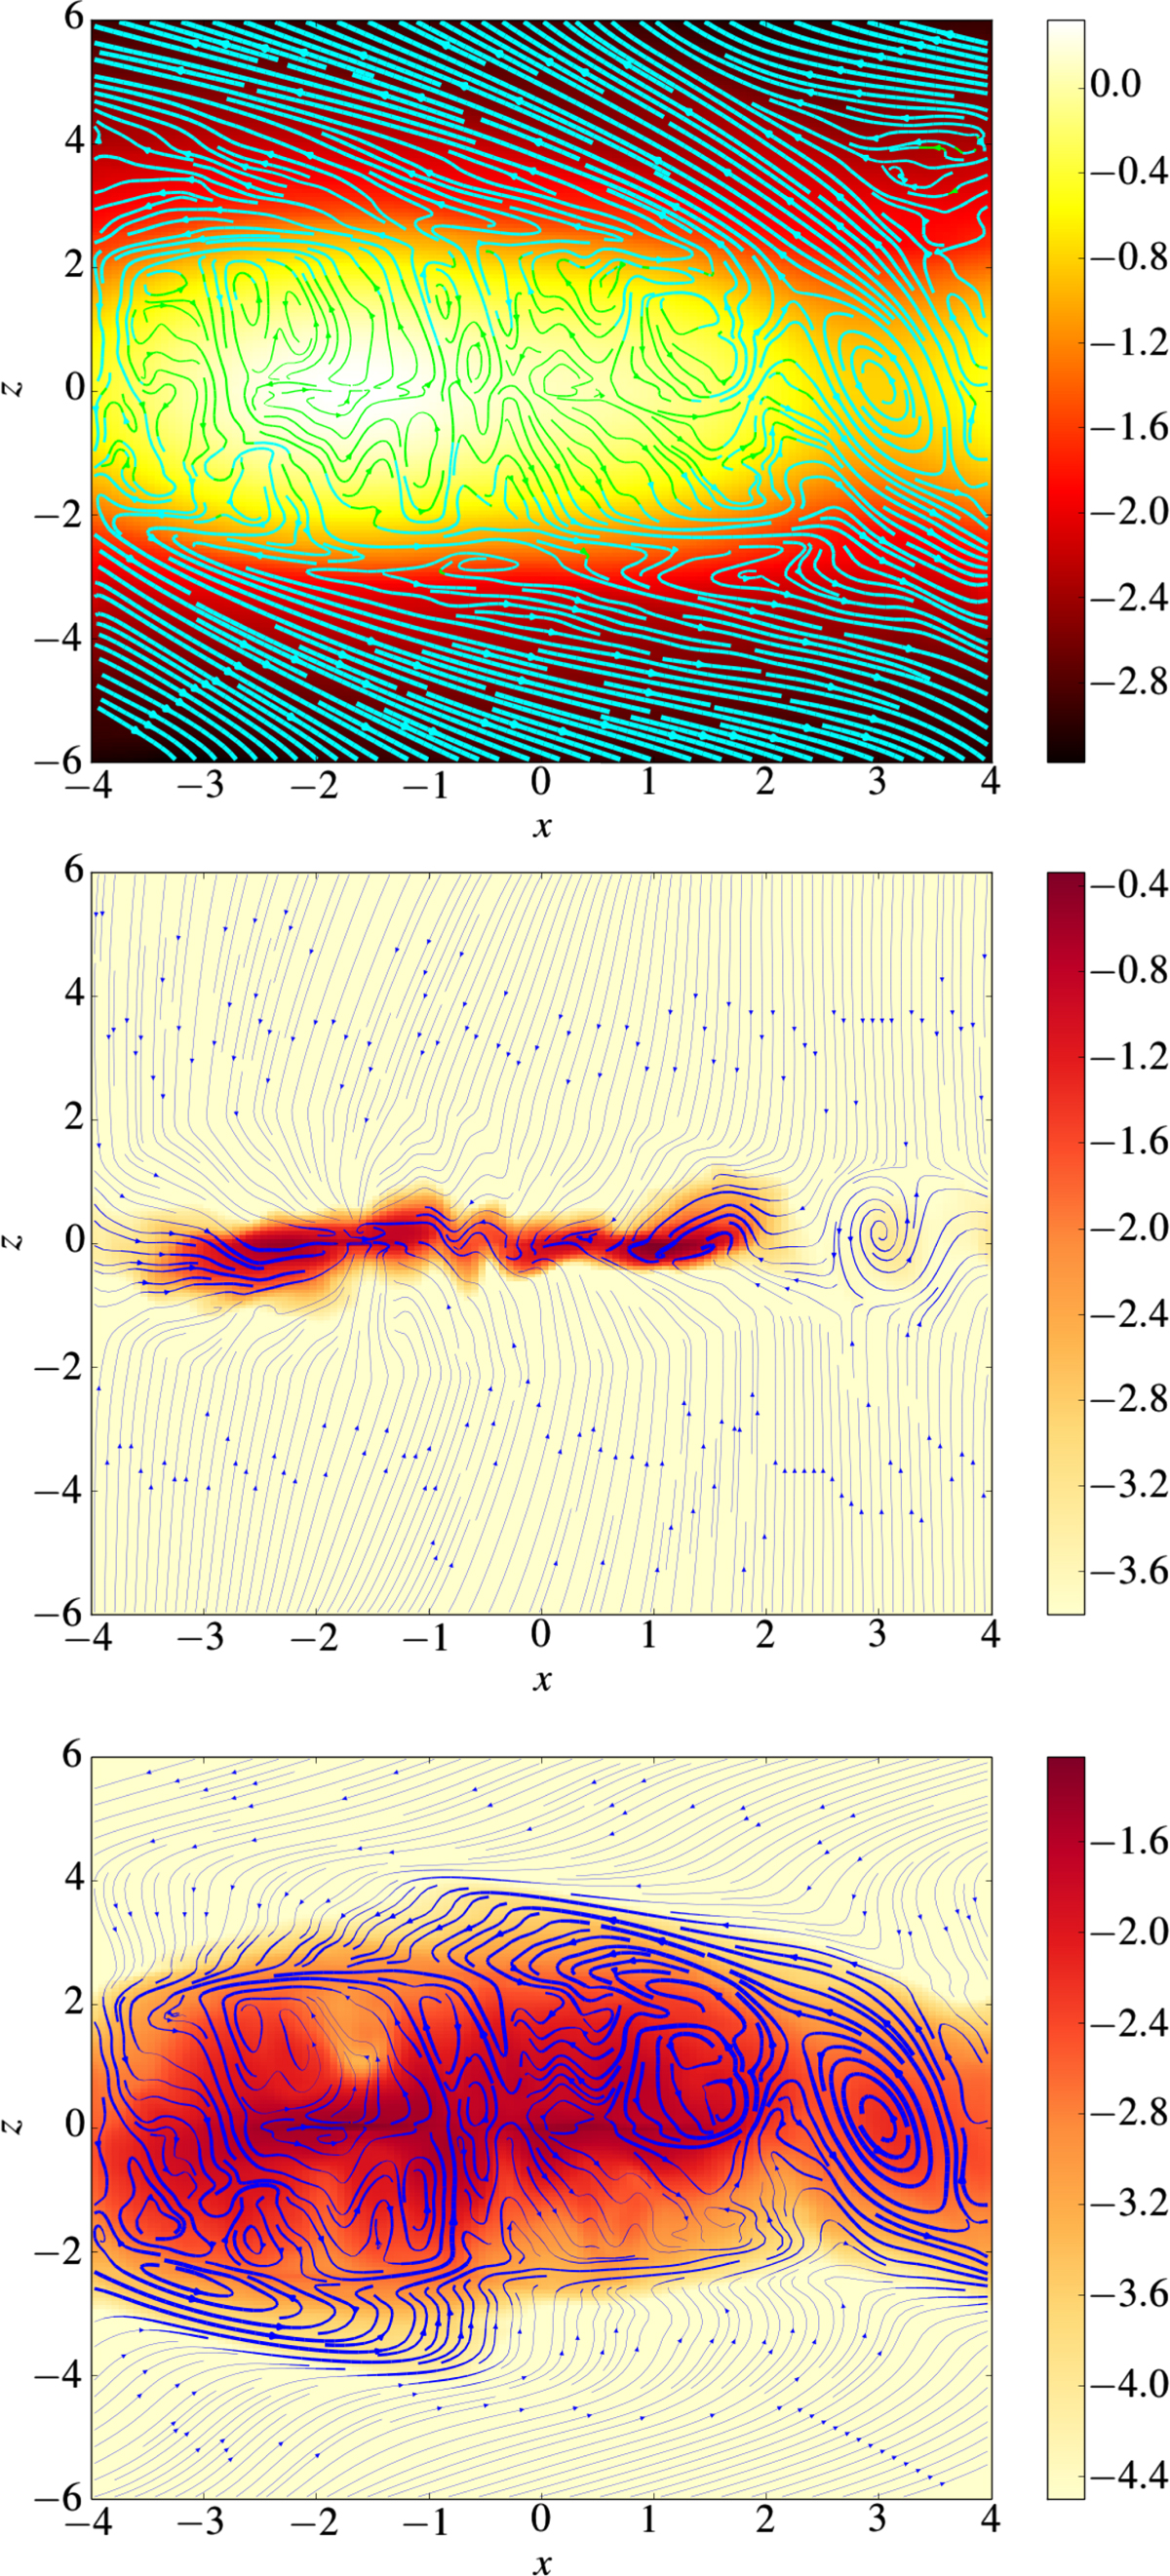
Top panel: gas density (colourmap) and poloidal streamlines (cyan lines) showing the outflow topology. The line thickness accounts for the norm of the velocity. Center panel: dust density (colourmap) and poloidal streamlines for St = 0.01. The thickness of the arrows accounts for the norm of the mass flux ρdud. Lower panel: same for St = 0.001.
Current usage metrics show cumulative count of Article Views (full-text article views including HTML views, PDF and ePub downloads, according to the available data) and Abstracts Views on Vision4Press platform.
Data correspond to usage on the plateform after 2015. The current usage metrics is available 48-96 hours after online publication and is updated daily on week days.
Initial download of the metrics may take a while.