Fig. 17.
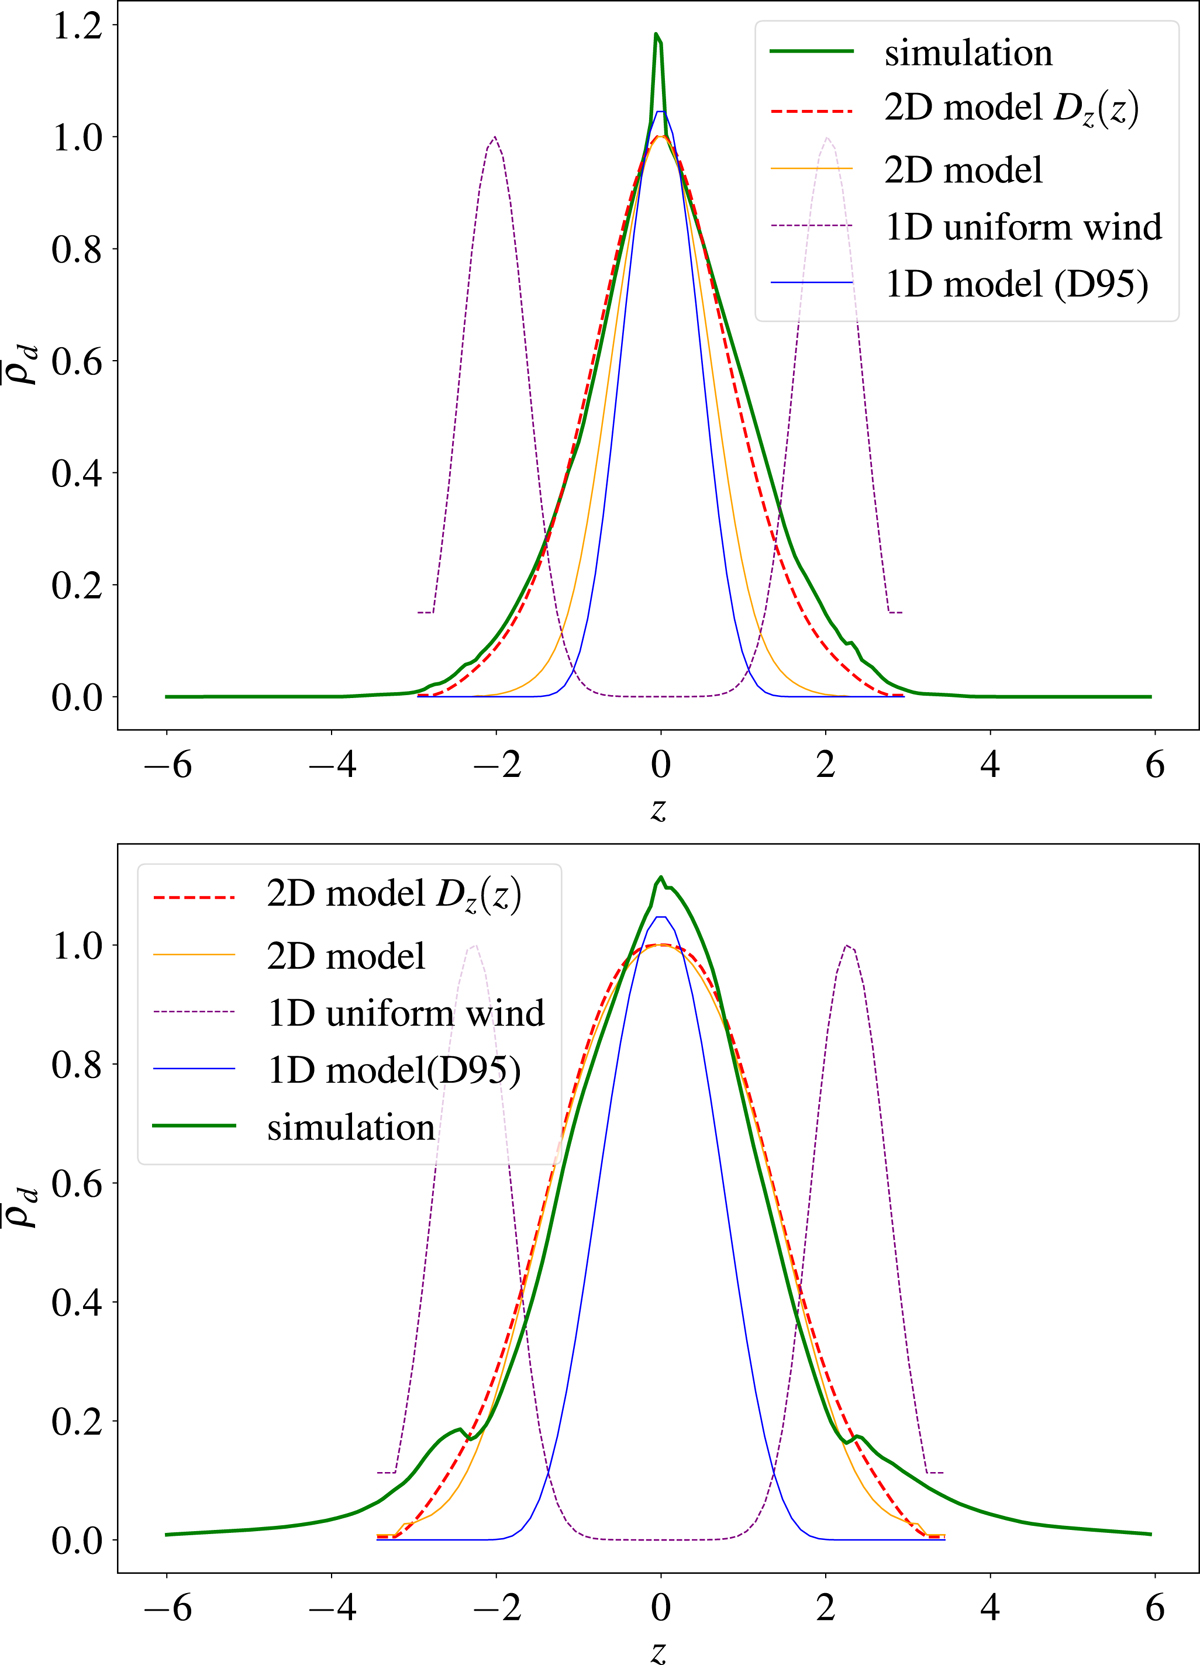
Comparison between different settling models for St = 0.001 (top) and St = 0.00025 (bottom) in the case β = 103. The green line represents the vertical density profile obtained from the simulation. The red/dashed and orange lines are computed from the 2D semi-analytical models with parameters detailed in Sect. 5.2.2. The red line is with non-uniform Dz in z while the orange corresponds to Dz = const. The blue and purple/dotted lines are analytical solutions derived from a 1D diffusion model (Dubrulle et al. 1995) respectively without wind and with uniform wind. All profiles are normalized to unity in the midplane to allow comparison.
Current usage metrics show cumulative count of Article Views (full-text article views including HTML views, PDF and ePub downloads, according to the available data) and Abstracts Views on Vision4Press platform.
Data correspond to usage on the plateform after 2015. The current usage metrics is available 48-96 hours after online publication and is updated daily on week days.
Initial download of the metrics may take a while.