Fig. 15.
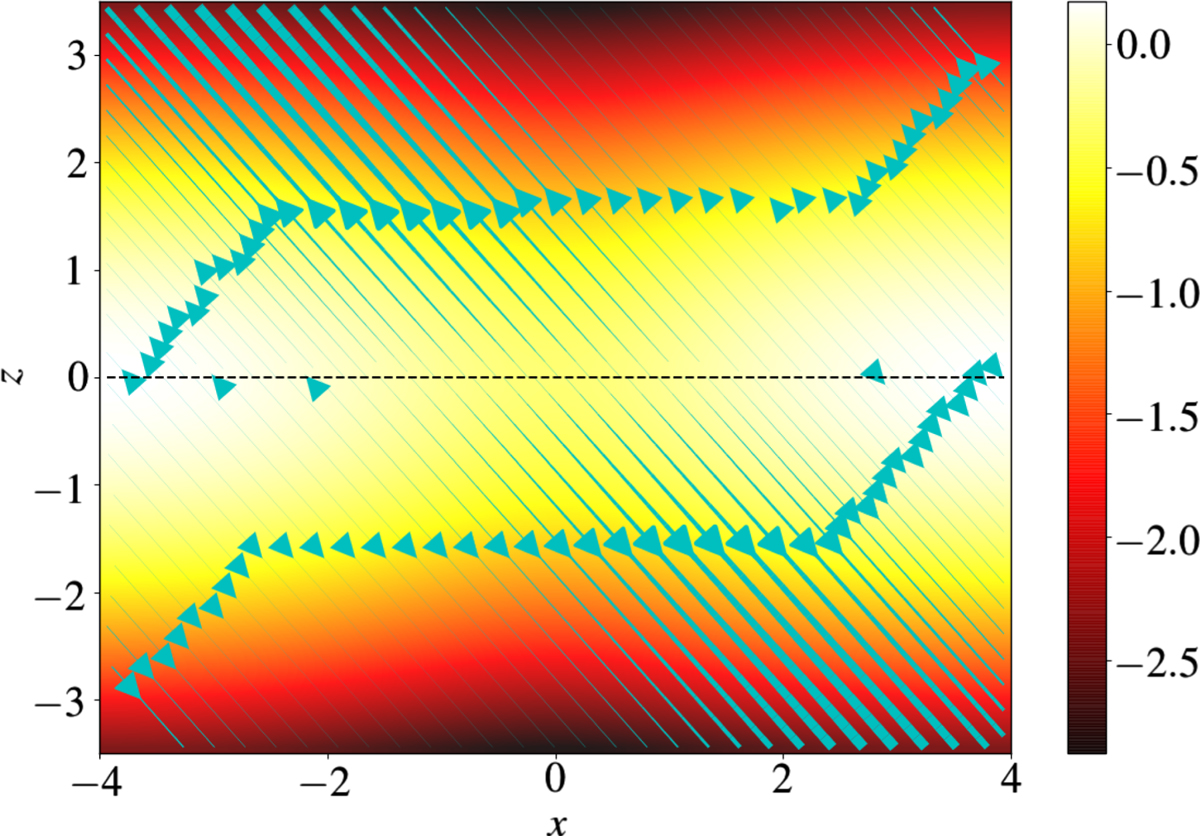
Gas density (colourmap) and velocity streamlines (cyan arrows) of the 2D toy model. The lines thickness is proportional to the velocity ‖υ‖. The outflow inclination, width and averaged intensity are fixed and equal respectively to i = 40∘, δ = 0.7H, and Ωw = 6 × 10⁻³ Ω. The density is Gaussian in z and has a cosine perturbation in x with amplitude Ax = 0.5. The outflow configuration can be directly compared with that of Fig. 9 (here the plume has been shifted towards the centre of the 2D domain).
Current usage metrics show cumulative count of Article Views (full-text article views including HTML views, PDF and ePub downloads, according to the available data) and Abstracts Views on Vision4Press platform.
Data correspond to usage on the plateform after 2015. The current usage metrics is available 48-96 hours after online publication and is updated daily on week days.
Initial download of the metrics may take a while.