Fig. 11.
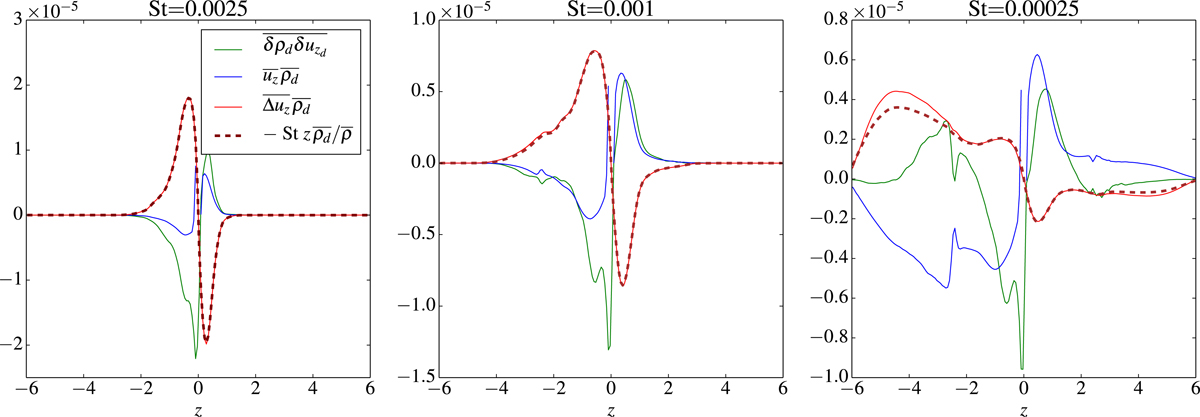
Vertical profiles of the flux terms appearing in the right-hand side of Eq. (31), calculated directly form simulations and averaged in time, for β = 104 and three different Stokes numbers. From left to right: St = 0.0025, 0.001 and 0.00025. Green, blue and red lines account respectively for the turbulent correlation term, mean wind and mean drift. The brown dashed line is the mean drift due to gravitational settling estimated in the terminal velocity approximation and assuming that ![]() (small gas density fluctuations).
(small gas density fluctuations).
Current usage metrics show cumulative count of Article Views (full-text article views including HTML views, PDF and ePub downloads, according to the available data) and Abstracts Views on Vision4Press platform.
Data correspond to usage on the plateform after 2015. The current usage metrics is available 48-96 hours after online publication and is updated daily on week days.
Initial download of the metrics may take a while.