Free Access
Fig. 8
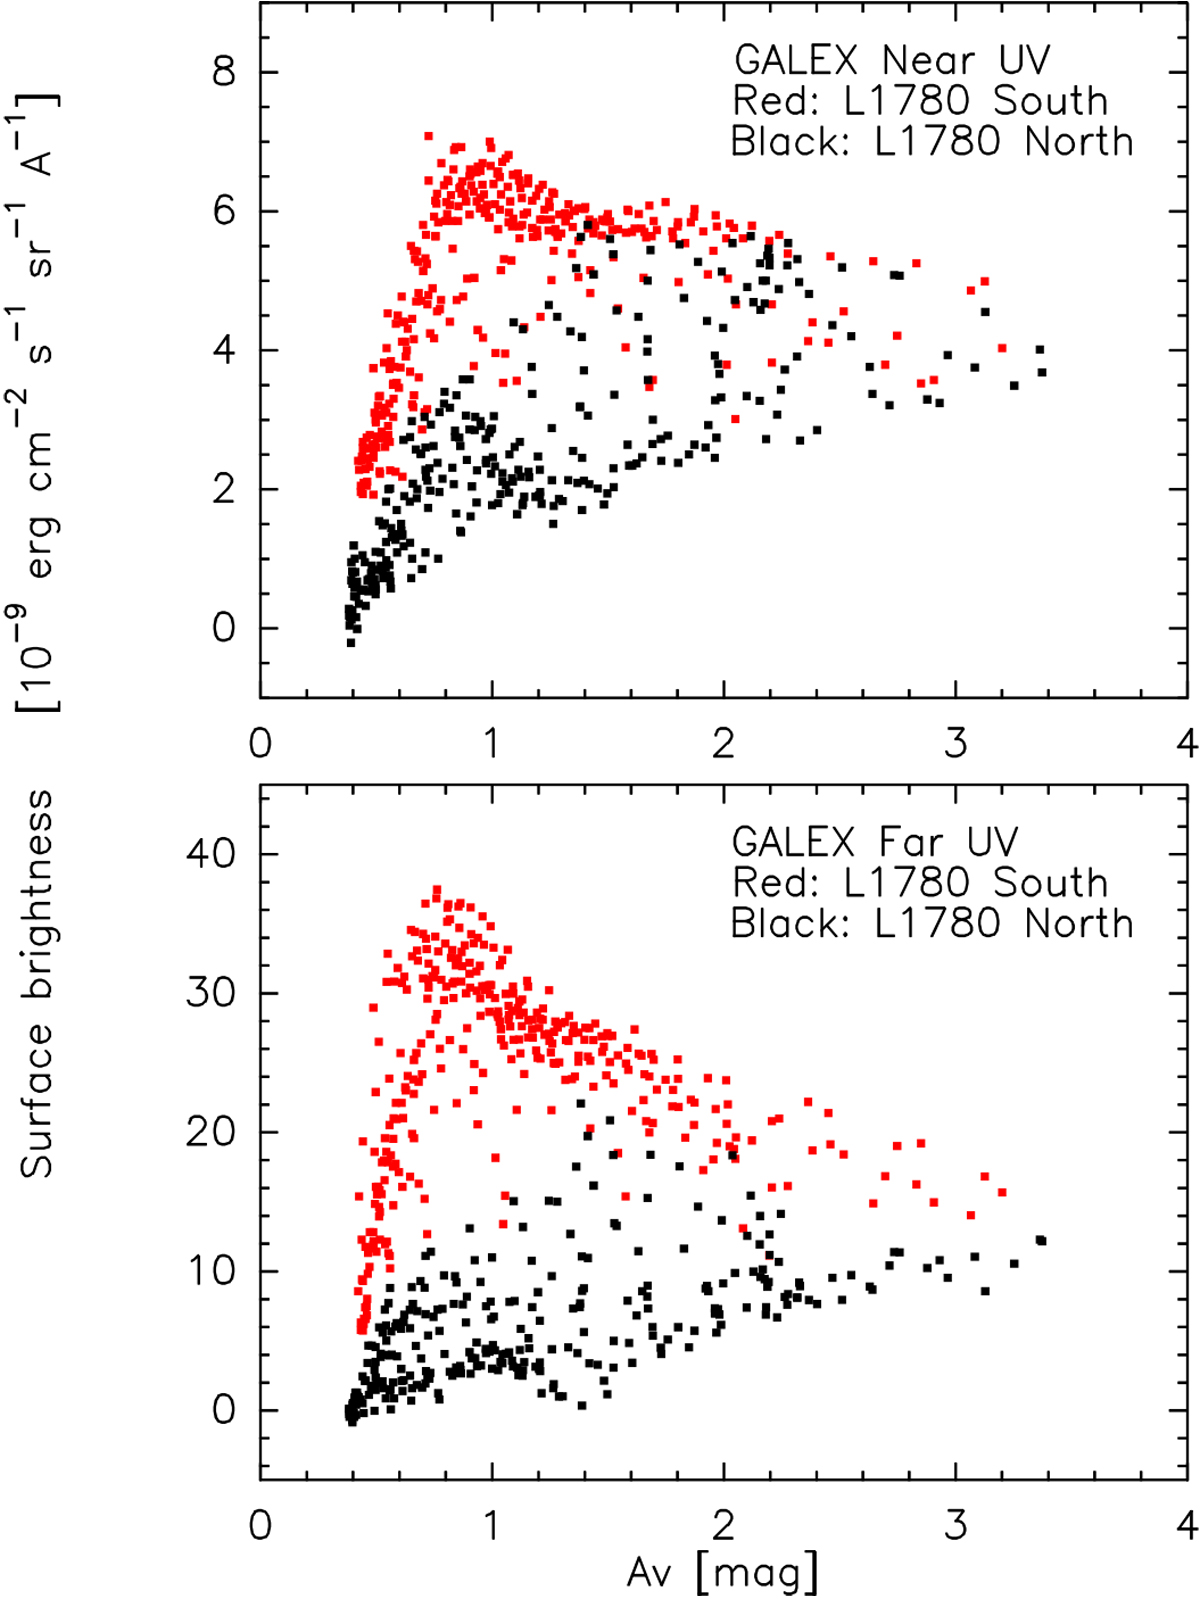
GALEX NUV (upper panel) and FUV (lower panel) surface brightness in LDN 1780 plotted against visual extinction. The red dots are for the southern (Dec < − 7°12′), the black dots for the northern (Dec ≥−7°12′) part of the cloud (RA < 15h 41.2m for both).
Current usage metrics show cumulative count of Article Views (full-text article views including HTML views, PDF and ePub downloads, according to the available data) and Abstracts Views on Vision4Press platform.
Data correspond to usage on the plateform after 2015. The current usage metrics is available 48-96 hours after online publication and is updated daily on week days.
Initial download of the metrics may take a while.