Fig. 7
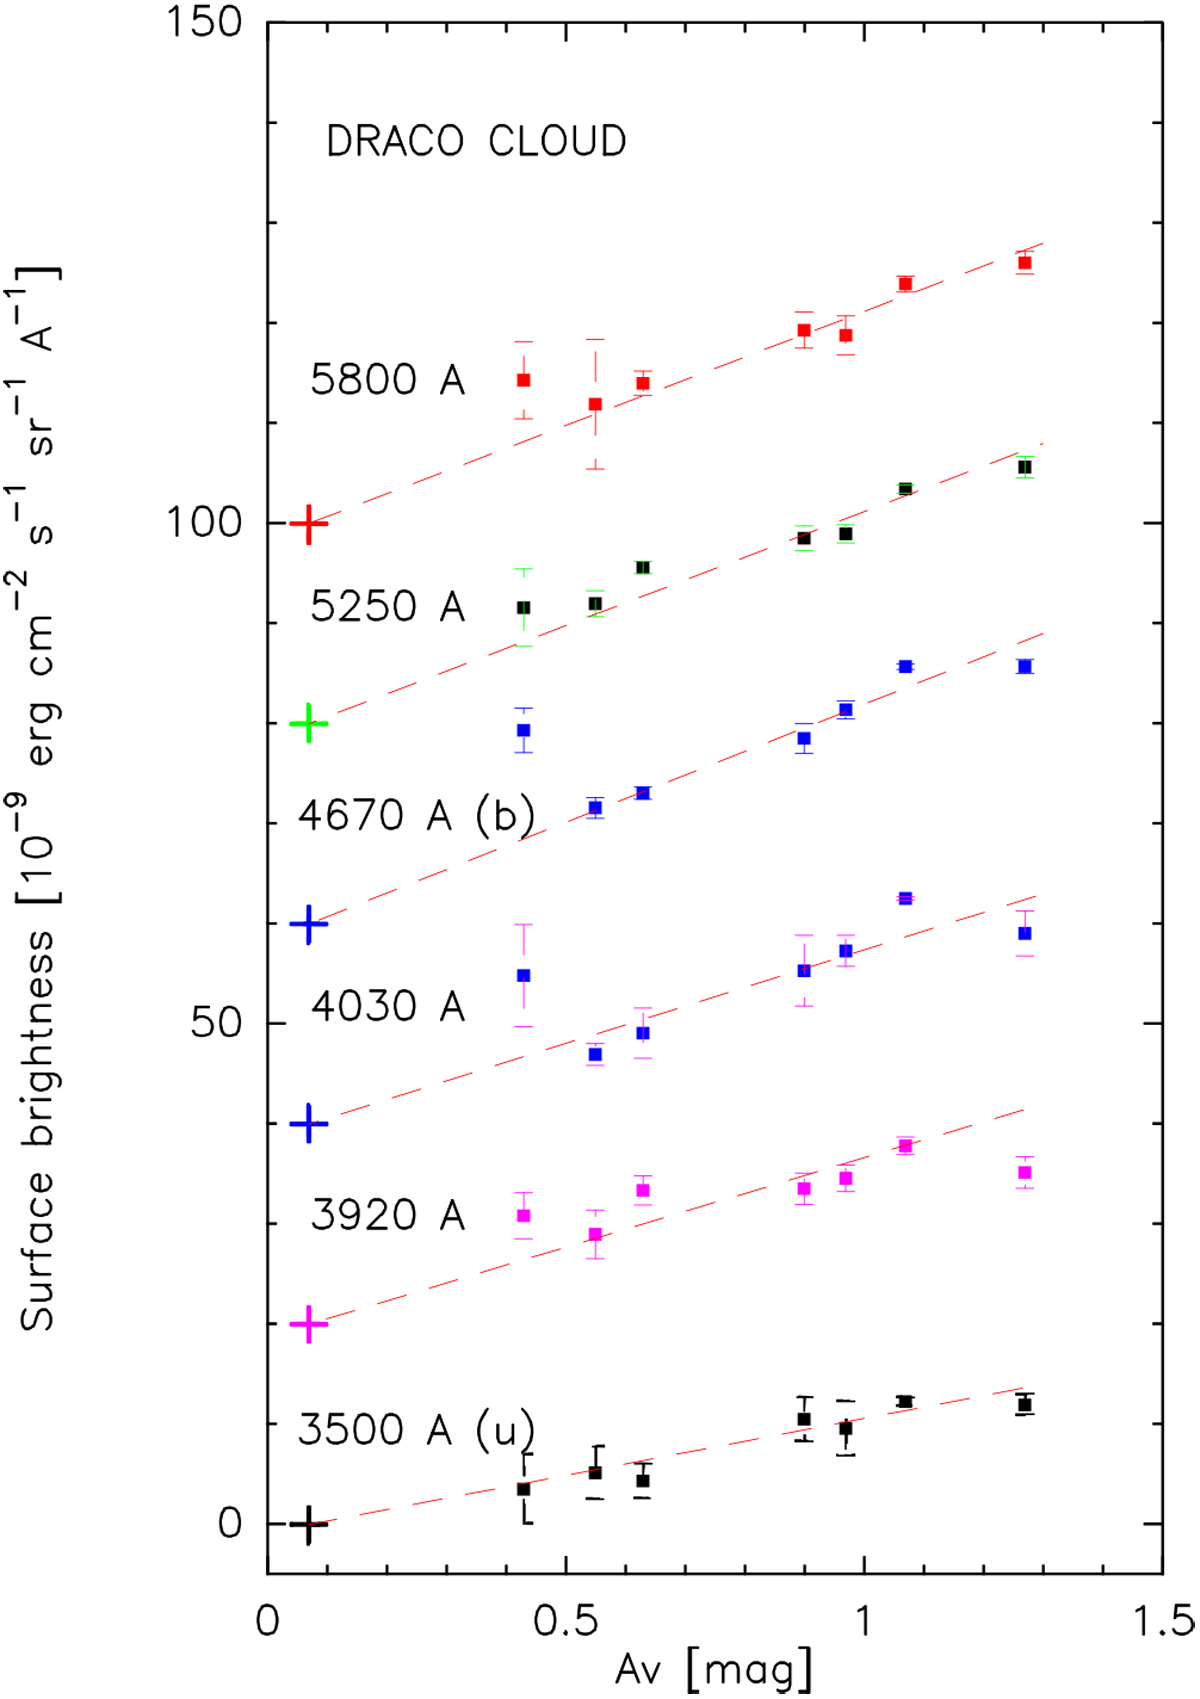
Surface brightness vs. visual extinction in the Draco nebula. The relationships are shown from bottom to top in different colours: 3500 Å (u) (black dots), 3920 Å (magenta, shifted by +20 units), 4030 Å (blue dots, +40 units), 4670 Å (b) (blue dots, +60 units), 5250 Å (black dots, +80 units), and 5800 Å (red dots, +100 units). The crosses at AV = 0.07 mag indicate the zero level for each surface brightness band. To guide the eye approximate linear fits are shown as dashed lines. Data for positions 1 and 3 (see Table 3) deviate by more than 3σ in most colours and are not shown in this plot.
Current usage metrics show cumulative count of Article Views (full-text article views including HTML views, PDF and ePub downloads, according to the available data) and Abstracts Views on Vision4Press platform.
Data correspond to usage on the plateform after 2015. The current usage metrics is available 48-96 hours after online publication and is updated daily on week days.
Initial download of the metrics may take a while.