Fig. 2
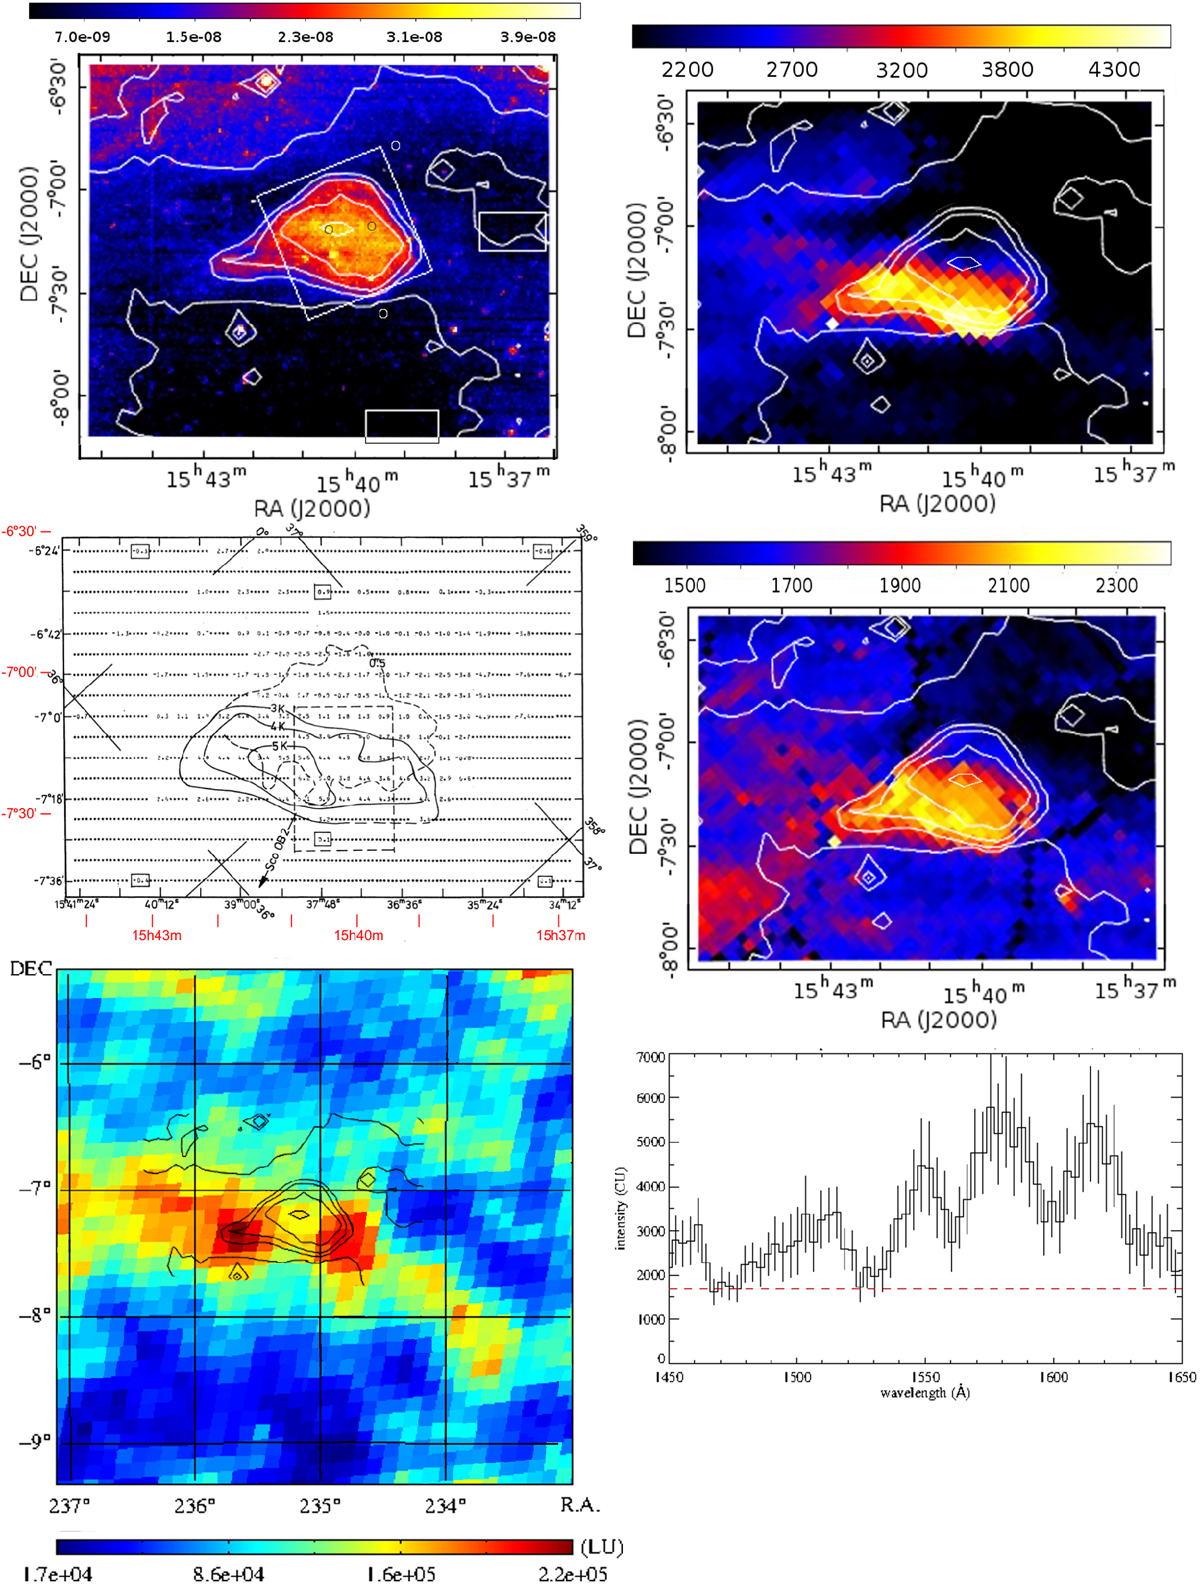
LDN 1780 data. Upper left panel: B band VYSOS image with Calar Alto photometry positions shown as circles, the ISOPHOT 200 μm map area shown as rectangle and the two surface brightness “zero” areas as rectangles; contours are at 30.0, 23.75, 17.5, 11.25, and 5.0 ×10⁻⁹ erg cm−2 s−1 sr−1 Å−1. Upper right panel: GALEX FUV map; middle right panel: GALEX NUV map; middle left panel: map of H I 21-cm excess emission (line area), adopted from Mattila & Sandell (1979) Fig. 5; bottom left panel: SPEAR/FIMS H2 fluorescence emission map; bottom right panel: SPEAR/FIMS spectrum at RA = 15h 42m (235. °5), Dec = − 7. °4 (J2000), the brightest H2 spot in the cloud. In the GALEX images some artefacts of the 1. °25 field edges are seen as black arcs; the contours of the B band image are overplotted in the GALEX and SPEAR/FIMS for reference. Coordinates for the H I 21-cm map are RA and Dec (B1950.0); approximate J2000 coordinates have been added in red. The AB = 0. m5 extinction contour is shown as a dashed line. For the colour bars of the GALEX images and for the SPEAR/FIMS spectrum the unit is ph s−1 cm−2 sr−1 Å−1; for the colour bar of the SPEAR/FIMS H2 image the unit is ph s−1 cm−2 sr−1 (=LU, line unit).
Current usage metrics show cumulative count of Article Views (full-text article views including HTML views, PDF and ePub downloads, according to the available data) and Abstracts Views on Vision4Press platform.
Data correspond to usage on the plateform after 2015. The current usage metrics is available 48-96 hours after online publication and is updated daily on week days.
Initial download of the metrics may take a while.