Fig. 15
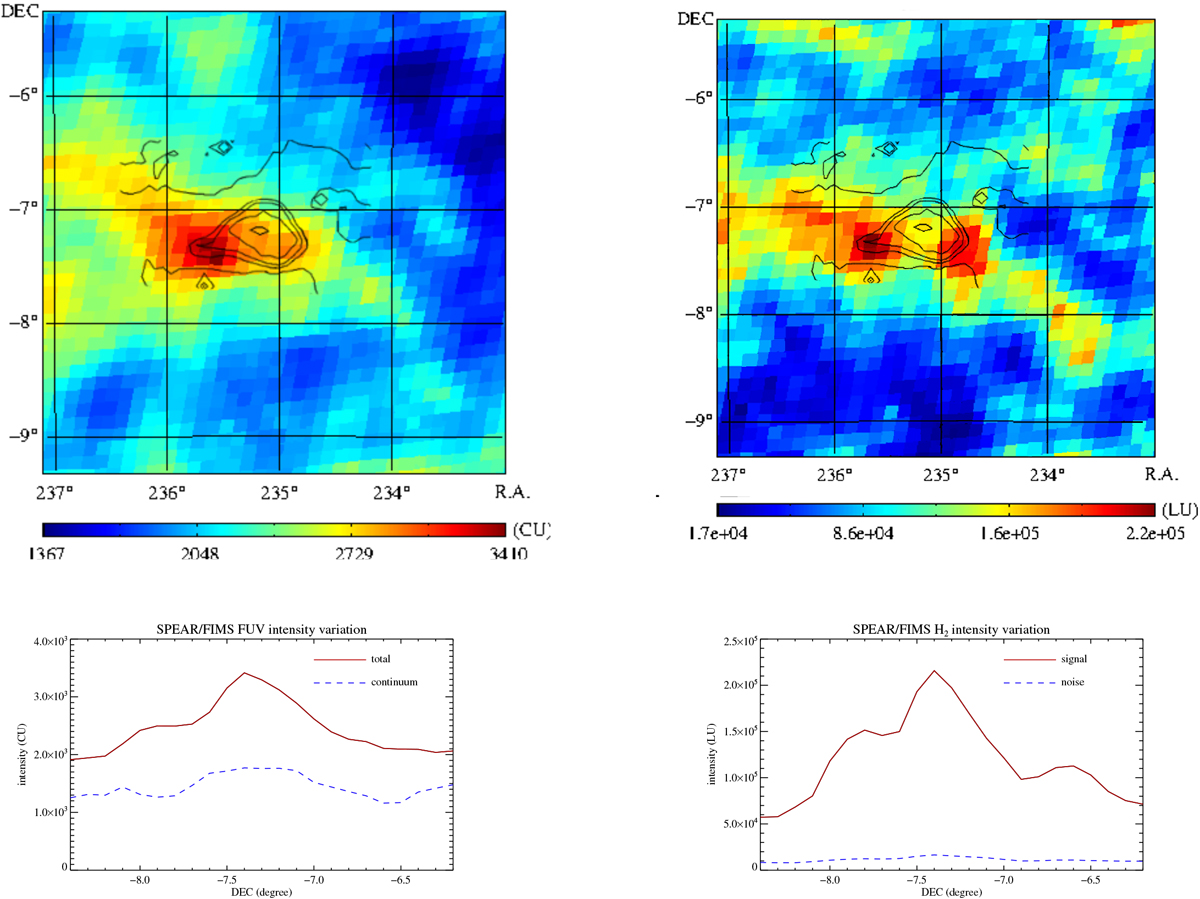
FUV continuum and H2 fluorescence emission in LDN 1780; upper left panel: SPEAR/FIMS FUV continuum map with B band surface brightnes contours overlayed; upper right panel: the SPEAR/FIMS H2 fluorescence emission map + B band contours; lower left panel: total (red line) and continuum (blue dashed line) intensities shown as function of the declination along the path from south to north; lower right panel: H2 intensity(red line) and its statistical error (blue dashed line) along the same path across LDN 1780. The intensity unit for the total and continuum is photons cm−2 s−1 sr−1 Å−1 (CU; continuum unit) and for the line emission photons cm−2 s−1 sr−1 (LU; line unit).
Current usage metrics show cumulative count of Article Views (full-text article views including HTML views, PDF and ePub downloads, according to the available data) and Abstracts Views on Vision4Press platform.
Data correspond to usage on the plateform after 2015. The current usage metrics is available 48-96 hours after online publication and is updated daily on week days.
Initial download of the metrics may take a while.