Fig. 9
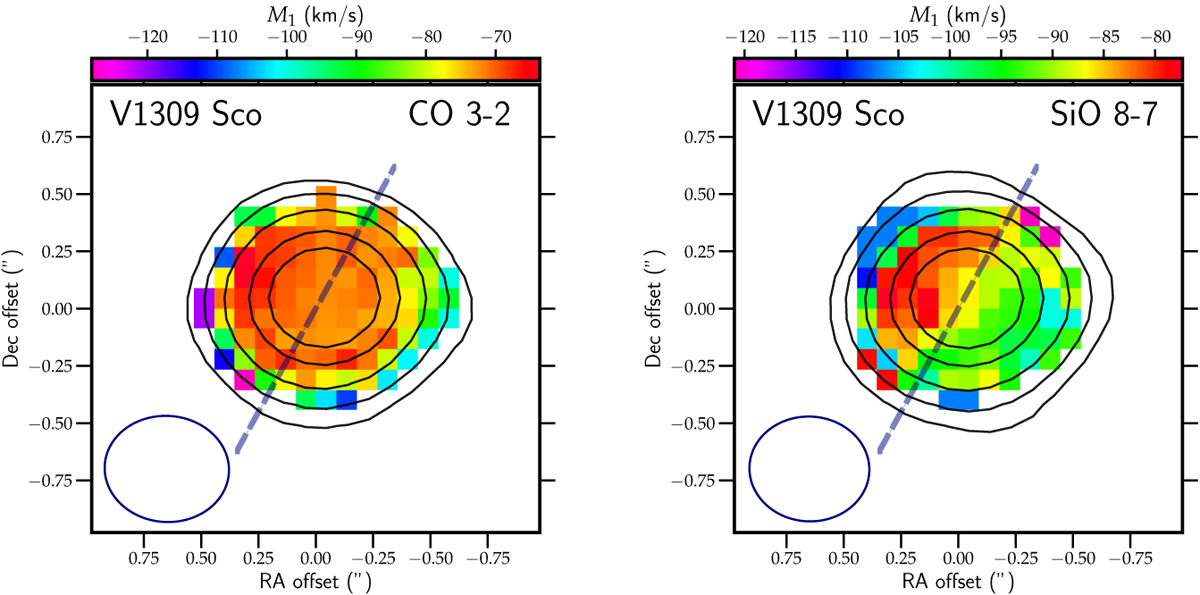
First-moment maps and contours of the total intensity of CO 3–2 (left panel) and SiO 8–7 (right panel) in V1309 Sco. The first-moment maps provide a view on the intensity-weighted mean velocity in the given pixel. The contours are drawn at 5, 10, 20, 40, 60, and 80% of the respective emission peaks. Beam sizes are marked in the corners. The dashed line is drawn at a PA = 151° along which the emission is slightly more extended.
Current usage metrics show cumulative count of Article Views (full-text article views including HTML views, PDF and ePub downloads, according to the available data) and Abstracts Views on Vision4Press platform.
Data correspond to usage on the plateform after 2015. The current usage metrics is available 48-96 hours after online publication and is updated daily on week days.
Initial download of the metrics may take a while.