Fig. 8
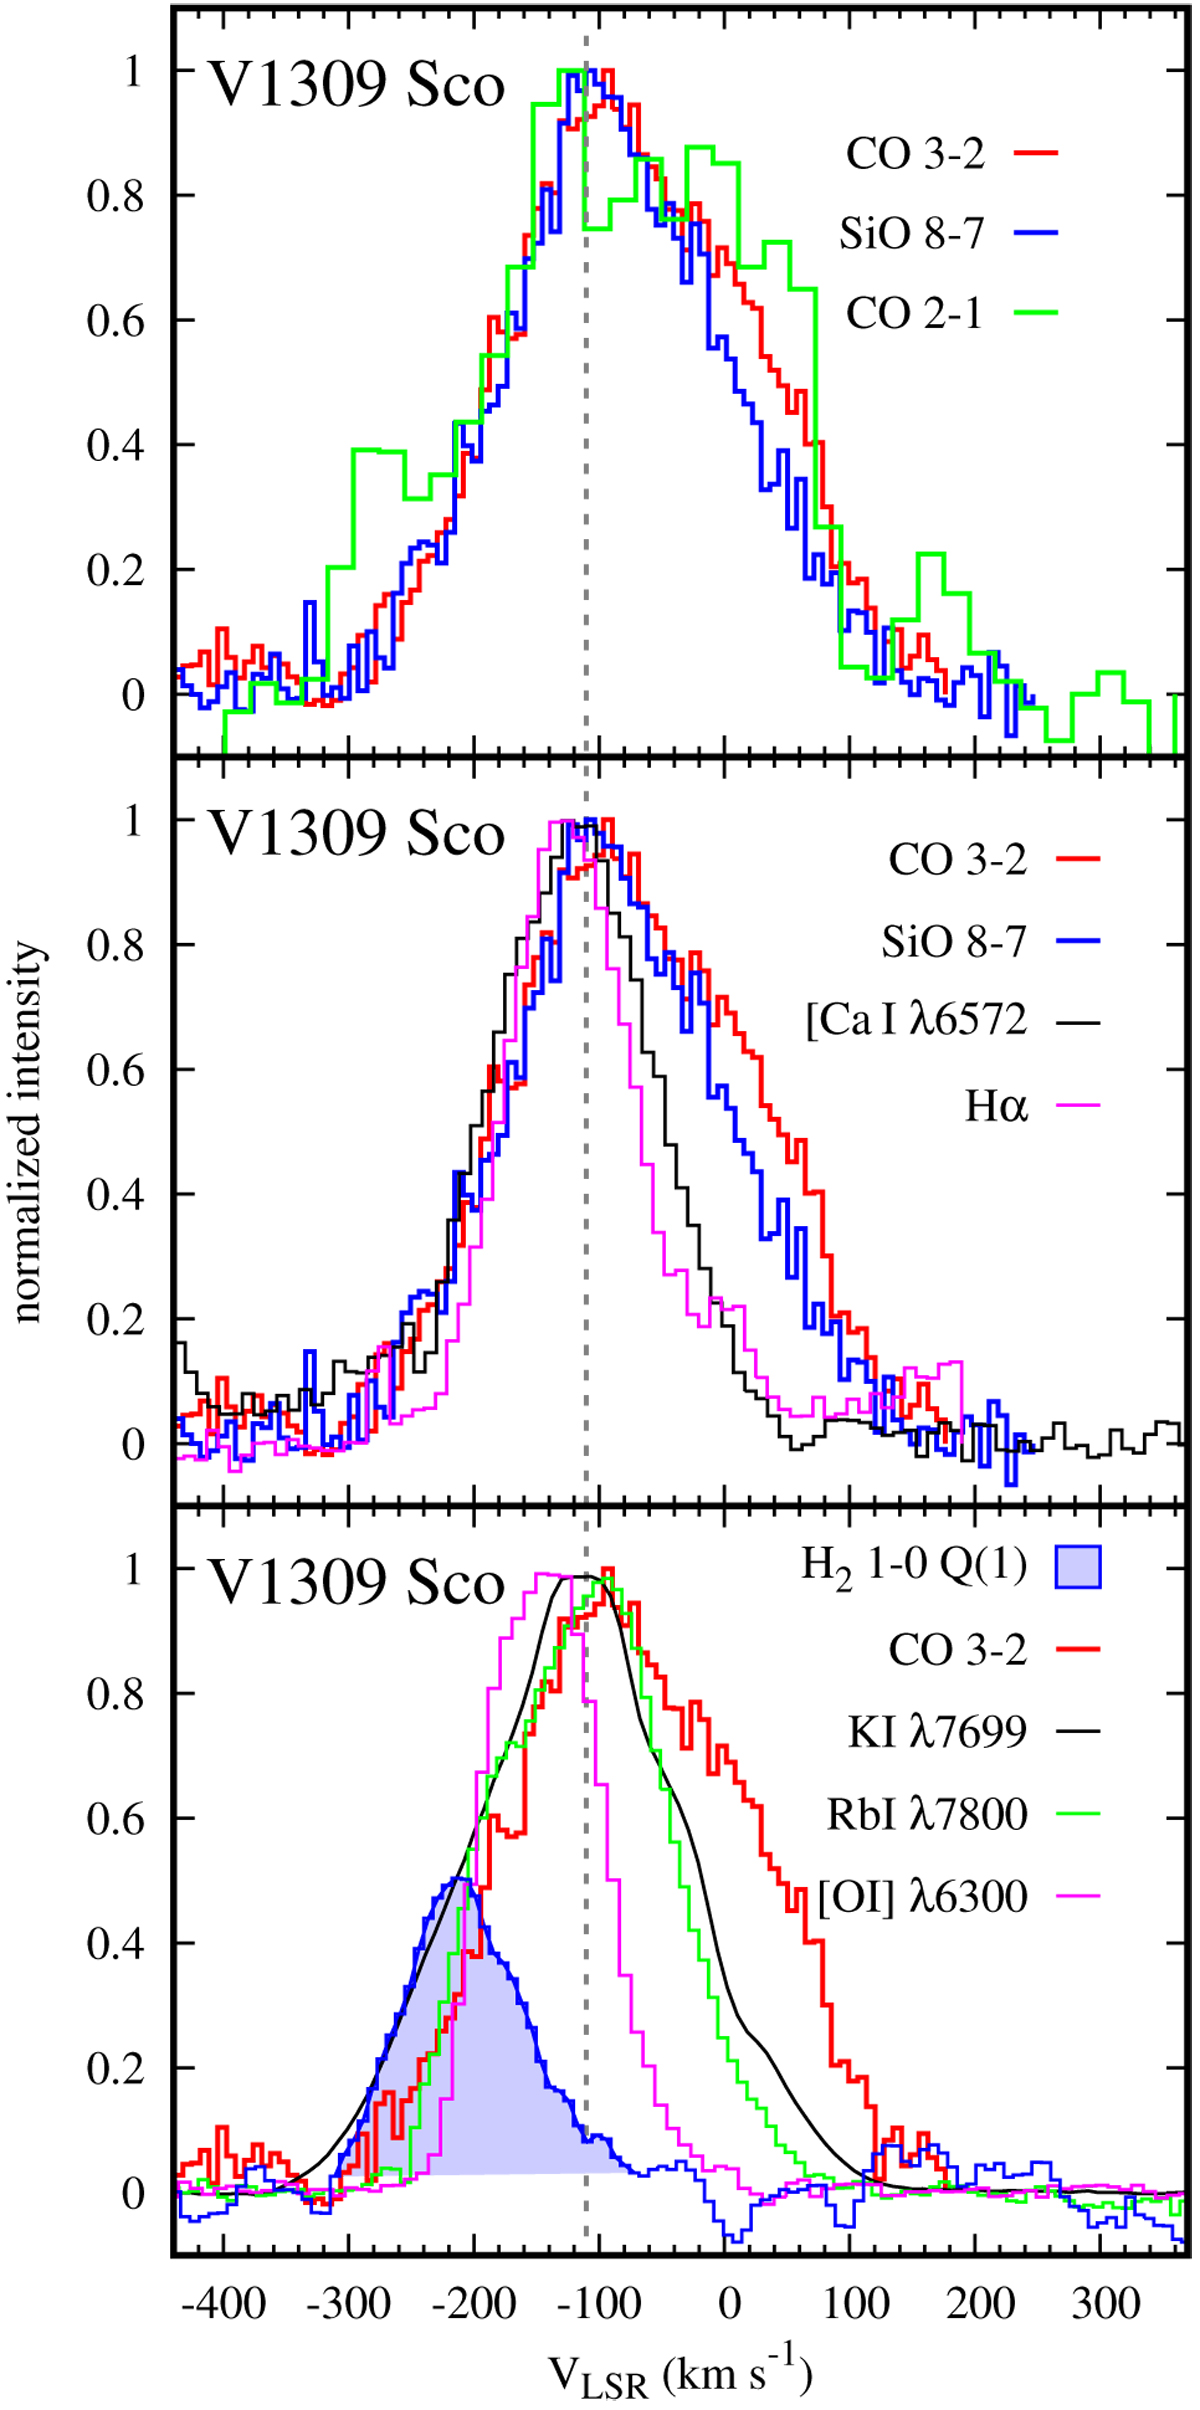
Sample emission profiles in V1309 Sco. They represent the entire emission region. Top panel: profiles of rotational emission of SiO 8–7 and CO 3–2 observed in January–April 2016; and of CO 2–1 observed in July 2015. Middle and bottom panels: molecular profiles observed in 2016 are compared to sample profiles observed in May–July 2016 in the visual. The profile of K I is affected by narrow telluric absorption features (chiefly in the red wing). The correction to the heliocentric velocity is –9.775 km s−1.
Current usage metrics show cumulative count of Article Views (full-text article views including HTML views, PDF and ePub downloads, according to the available data) and Abstracts Views on Vision4Press platform.
Data correspond to usage on the plateform after 2015. The current usage metrics is available 48-96 hours after online publication and is updated daily on week days.
Initial download of the metrics may take a while.