Fig. 6
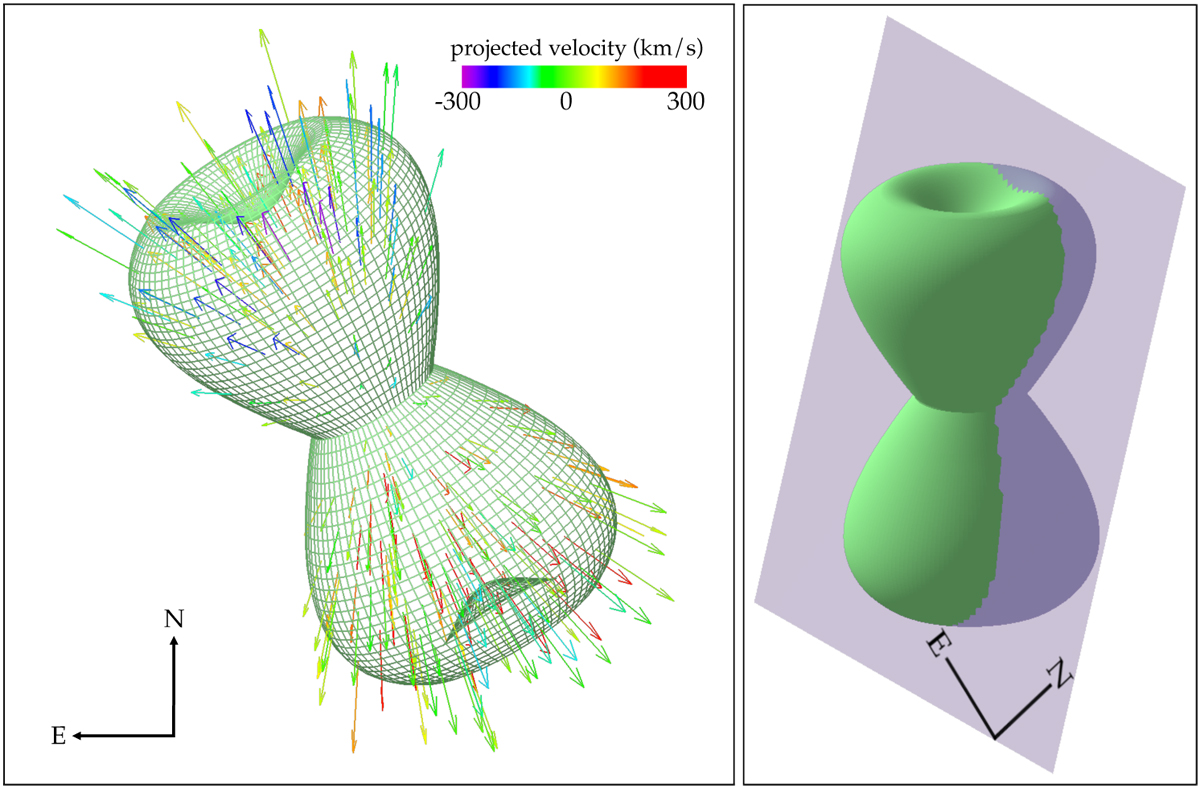
Model of the molecular outflow in V4332 Sgr. Left panel: observer’s view on the ouflow at i = 13°. The arrows represent the velocity field (v ∝r) within the volume of gas filling the bipolar structure. Their length is proportional to the velocity and their colors represent the projected velocity with color-coding indicated by the colorbar. Right panel: same structure shown from a side view. The purple plane represents the plane of the sky. The observer is located approximately to the left and the purple-shaded part of the bipolar structure is the far side for the observer.
Current usage metrics show cumulative count of Article Views (full-text article views including HTML views, PDF and ePub downloads, according to the available data) and Abstracts Views on Vision4Press platform.
Data correspond to usage on the plateform after 2015. The current usage metrics is available 48-96 hours after online publication and is updated daily on week days.
Initial download of the metrics may take a while.