Fig. 4
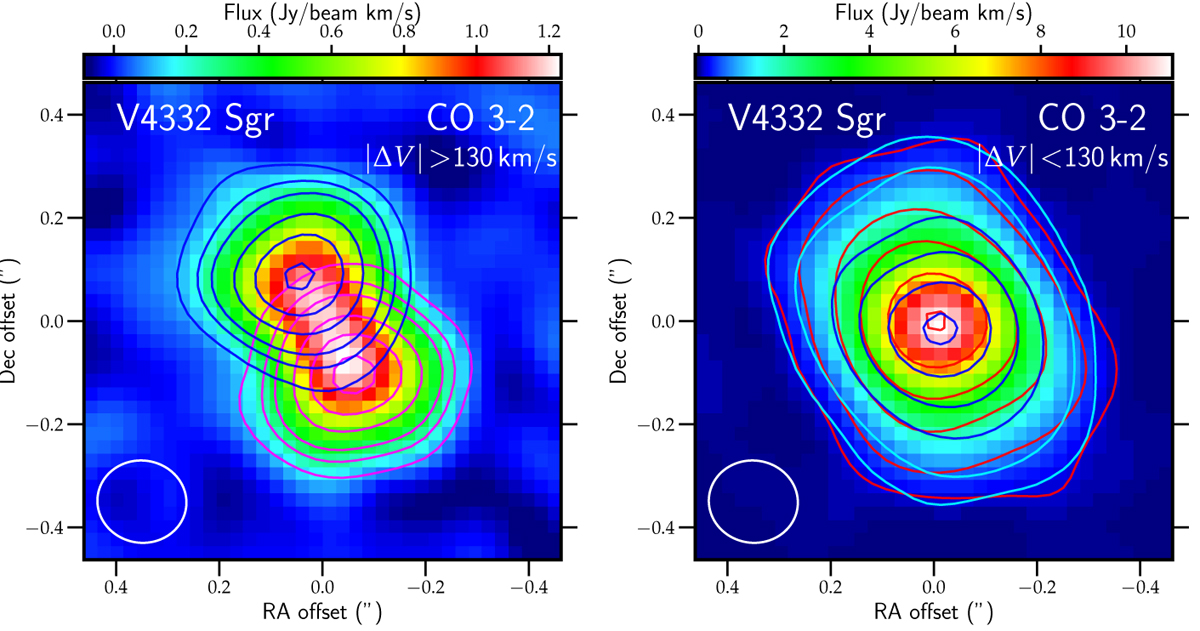
Maps of CO emission in V4332 Sgr. Left panel: high-velocity outflow with |Δ V | >130 km s−1. The blue and magenta countours show the blue- and red-shifted components, respectively, and the image shows the summary flux. The contours are drawn at levels of [5, 10, 15, 25,35, 45] times the respective rms. Right panel: intense CO core emission at |Δ V | <130 km s−1. The contours are drawn at [5, 15, 45, 90, 160, 235] times the rms; red and blue/cyan contours represent emission that is red- and blue-shifted, respectively (relative to V LSR = –54 km s−1). The background image shows the cumulative flux of both components.
Current usage metrics show cumulative count of Article Views (full-text article views including HTML views, PDF and ePub downloads, according to the available data) and Abstracts Views on Vision4Press platform.
Data correspond to usage on the plateform after 2015. The current usage metrics is available 48-96 hours after online publication and is updated daily on week days.
Initial download of the metrics may take a while.