Fig. 3
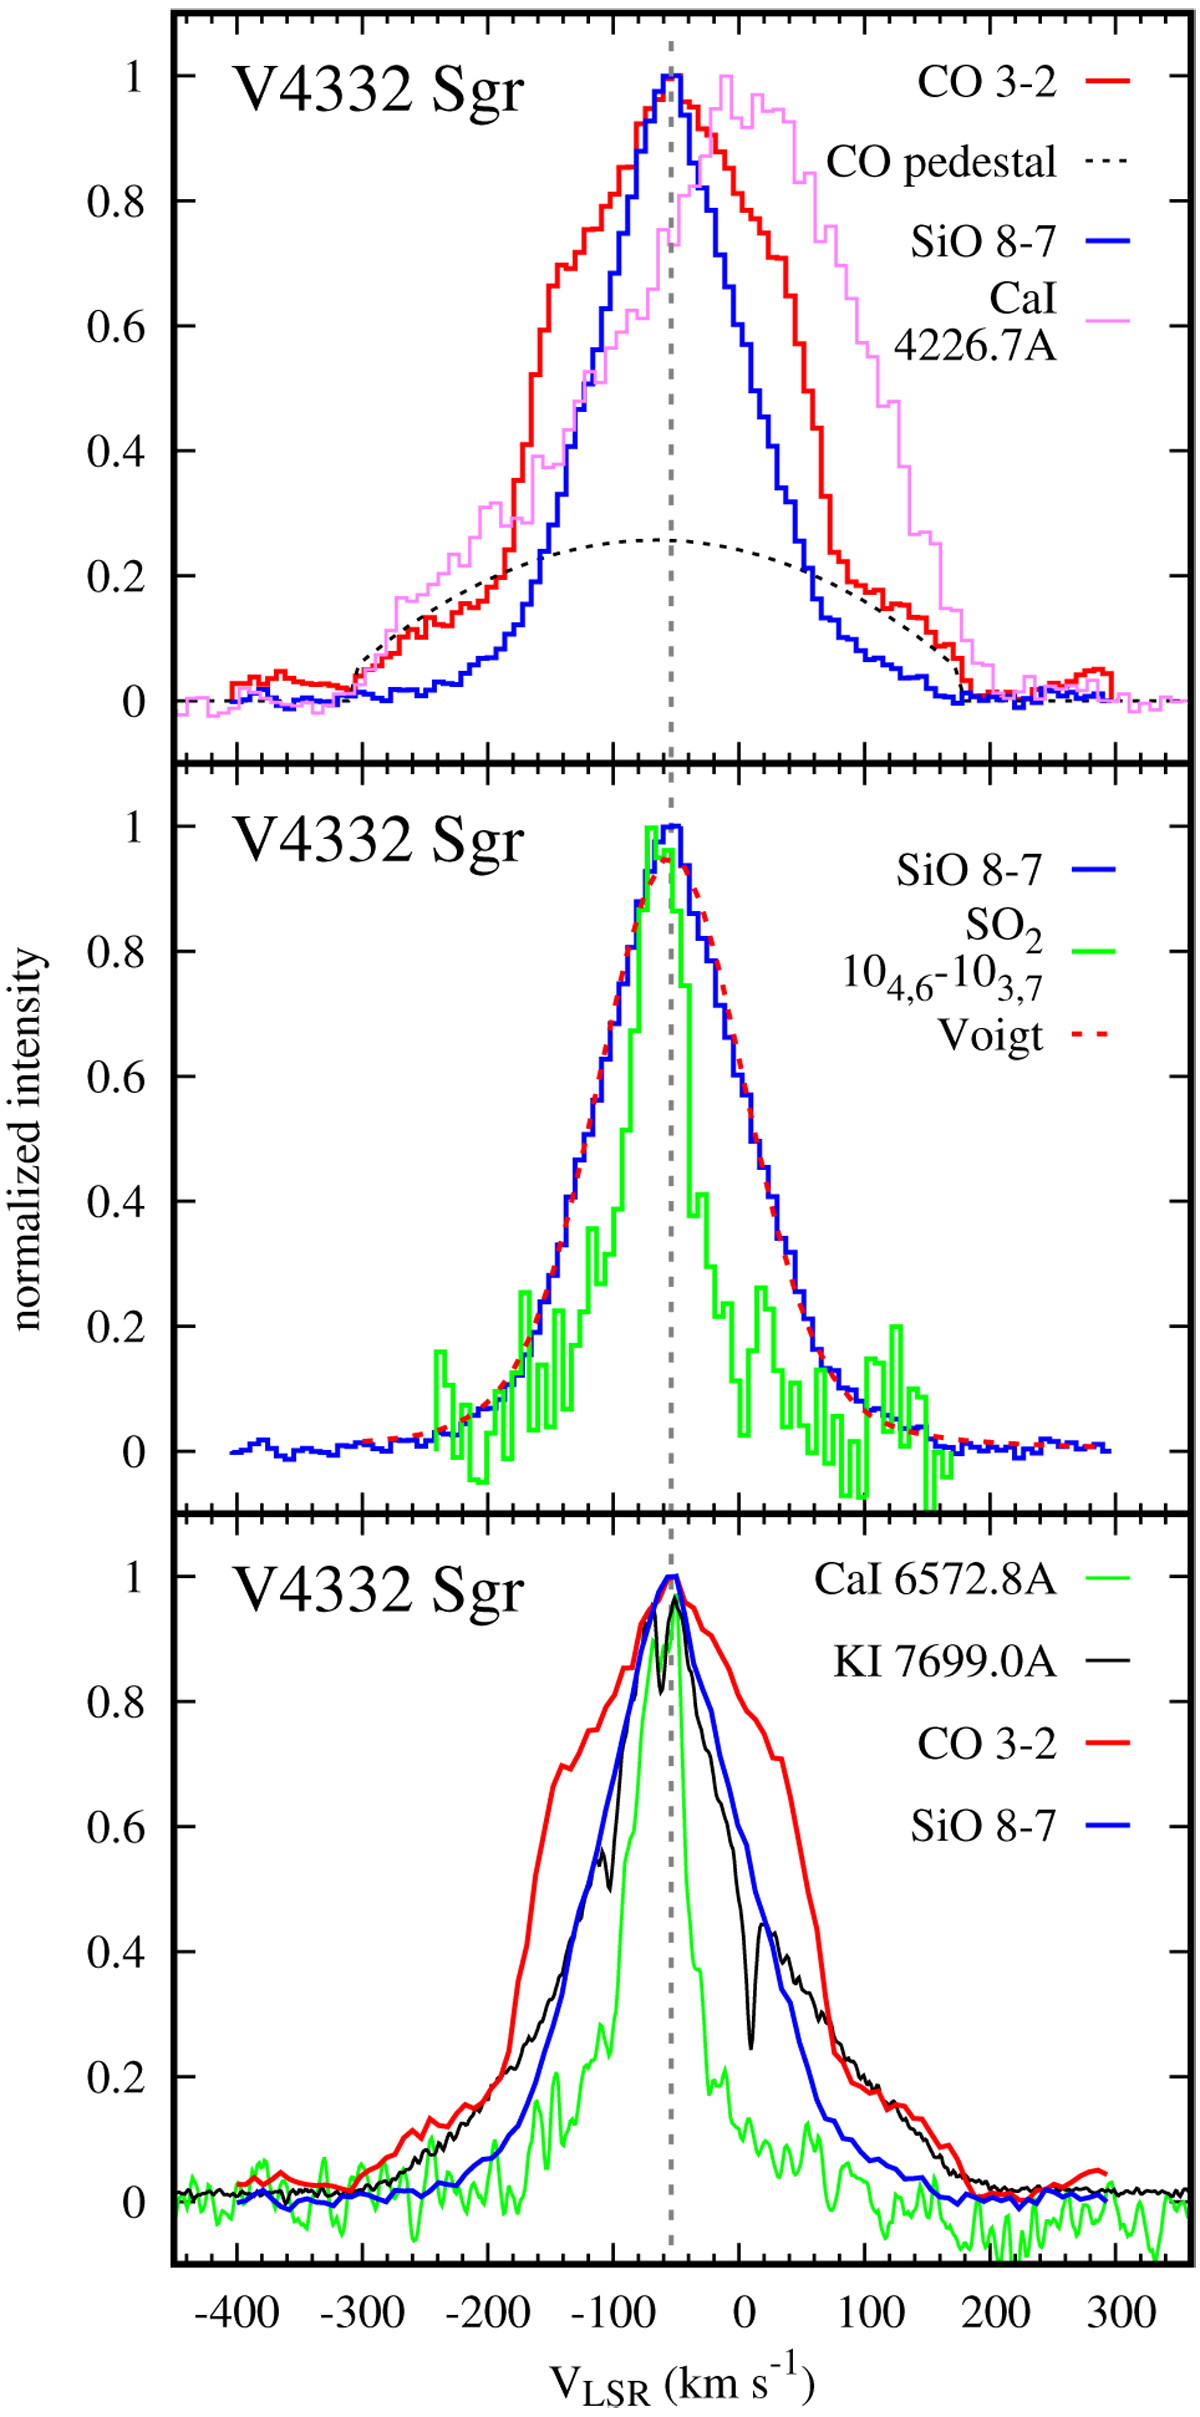
Sample emission profiles in V4332 Sgr representing the entire emission region. Top panel: profiles of rotational emission of SiO 8–7 and CO 3–2. The black dashed line shows the best-fit parabola representing the high-velocity component. Middle panel: profile of SiO is compared to a Voigt profile and the narrower line of SO2 104,6 –103,7 is also shown. Bottom panel: two ALMA lines from the top panel are compared to electronic transitions of K I (at 7698.974 Å) and Ca I (at 6572.779 Å) observed in the visual (from Kamiński et al. 2010). The narrow absorption dips in the profile of K I are mainly interstellar lines. The correction to heliocentric velocity is –12.144 km s−1.
Current usage metrics show cumulative count of Article Views (full-text article views including HTML views, PDF and ePub downloads, according to the available data) and Abstracts Views on Vision4Press platform.
Data correspond to usage on the plateform after 2015. The current usage metrics is available 48-96 hours after online publication and is updated daily on week days.
Initial download of the metrics may take a while.