Free Access
Fig. 12
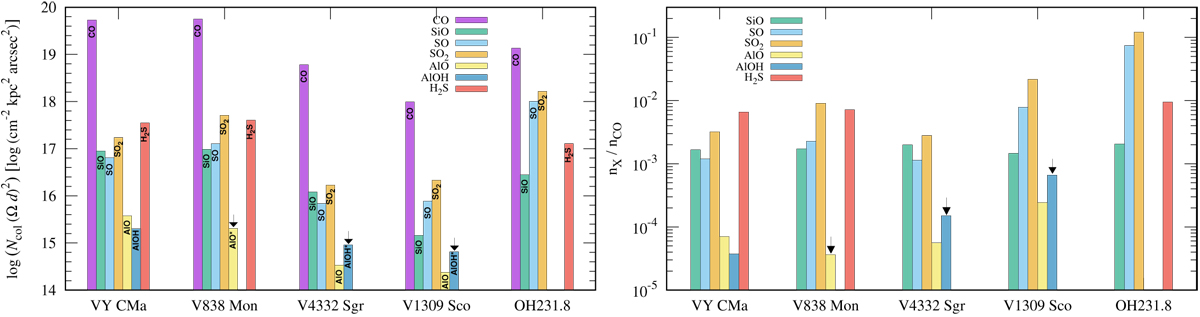
Left panel: source-averaged numbers of molecules in the three red novea, VY CMa, and OH231.8. Upper limits are indicated with arrows and asterisks in the labels. Right panel: same histogram but with molecule numbers normalized to that of CO in each object.
Current usage metrics show cumulative count of Article Views (full-text article views including HTML views, PDF and ePub downloads, according to the available data) and Abstracts Views on Vision4Press platform.
Data correspond to usage on the plateform after 2015. The current usage metrics is available 48-96 hours after online publication and is updated daily on week days.
Initial download of the metrics may take a while.