Fig. 11
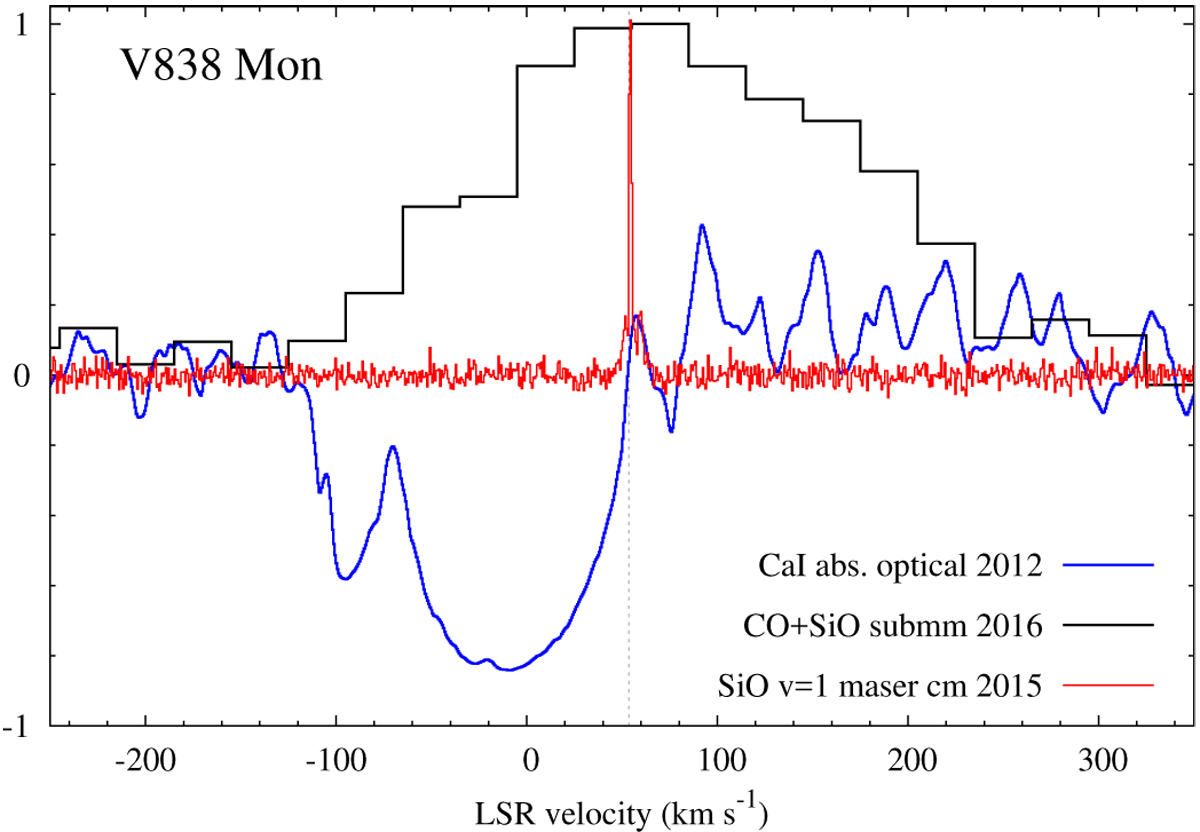
A mean profile of molecular emission observed with the SMA (black) in V838 Mon is compared to the SiO v = 1 J = 2–1 spectrum and an optical absorption profile of Ca I at 6573 Å. The profile of molecular emission is a mean of normalized unblended lines of CO and of 28,29SiO observed in 2016. The maser emission near 86 GHz was observed with the IRAM 30 m telescope in 2015. The maser defines the systemic velocity of the star which is marked with a vertical dashed line. The absorption profile of Ca I was extracted from a spectrum obtained in 2012 with VLT/UVES; it was normalized and shifted by –1. Its deep double absorption trough represents circumstellar absorption on the line of sight toward the star. A wavy pattern in the optical spectrum is caused by molecular absorption features, mainly by electronic bands of TiO.
Current usage metrics show cumulative count of Article Views (full-text article views including HTML views, PDF and ePub downloads, according to the available data) and Abstracts Views on Vision4Press platform.
Data correspond to usage on the plateform after 2015. The current usage metrics is available 48-96 hours after online publication and is updated daily on week days.
Initial download of the metrics may take a while.