Fig. 1
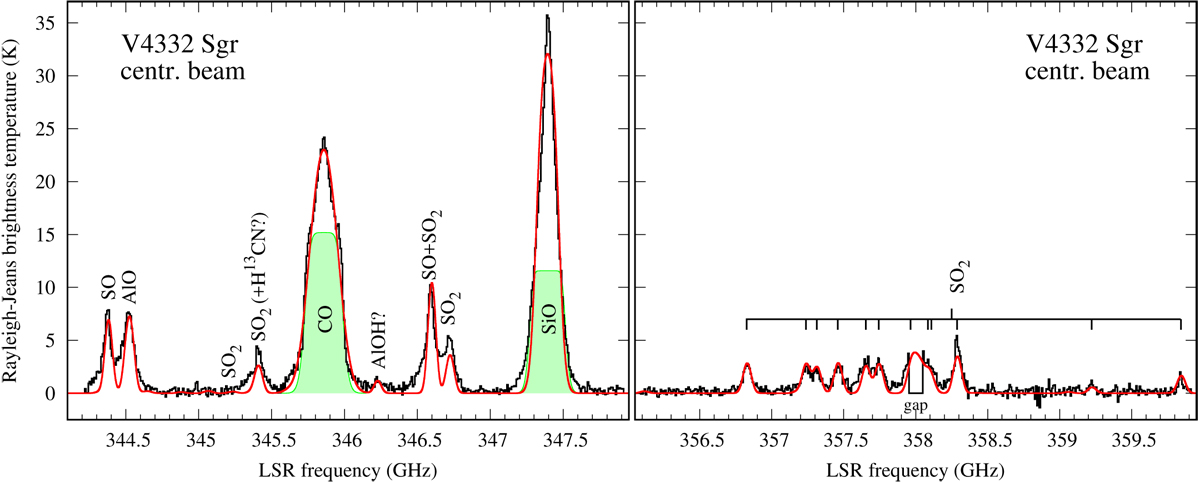
ALMA spectrum of V4332 Sgr and its simulations. The observed spectrum is shown with black lines and was extracted for the central beam of the molecular region. The spectrum is expressed in the Rayleigh–Jeans brightness temperature. Our best CASSIS simulation of all the spectral features at a single excitation temperature of 93 K is shown with a red line. The green line and shaded areas show model SiO and CO emission excited in gas of a temperature of 34 K; the profiles are highly saturated and the column densities cannot be reliably constrained. All spectral features seen in the right panel are of SO2.
Current usage metrics show cumulative count of Article Views (full-text article views including HTML views, PDF and ePub downloads, according to the available data) and Abstracts Views on Vision4Press platform.
Data correspond to usage on the plateform after 2015. The current usage metrics is available 48-96 hours after online publication and is updated daily on week days.
Initial download of the metrics may take a while.