Fig. 8
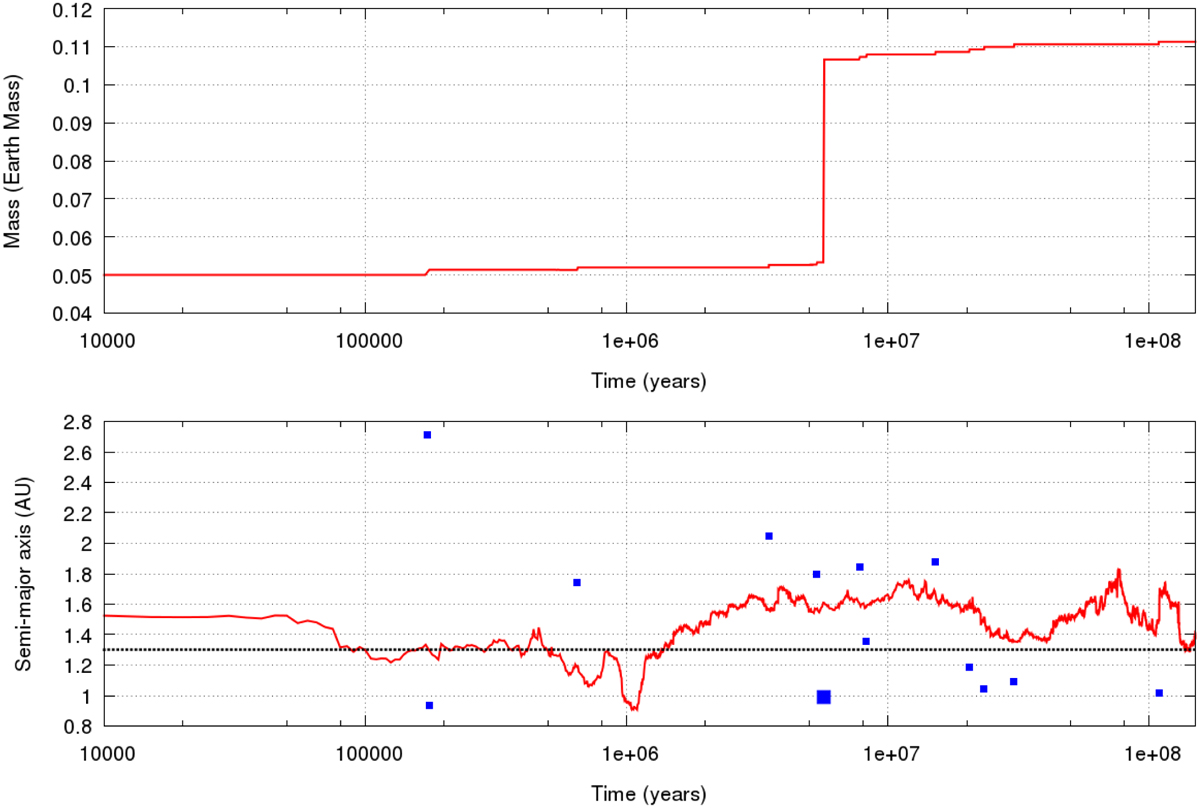
Evolution of mass and semi-major axis, respectively, of a Mars analogue (red solid lines in both panels) with a final 50:50 composition in the Grand Tack simulation with initial equal mass embryos. The squares in the lower panel represent the initial semi-major axes and the collision time with the Mars analogue of the planetesimals (smaller squares) and embryos (larger square). The black dotted horizontal line at 1.3 AU in the lower panel is the break location of the initial disk.
Current usage metrics show cumulative count of Article Views (full-text article views including HTML views, PDF and ePub downloads, according to the available data) and Abstracts Views on Vision4Press platform.
Data correspond to usage on the plateform after 2015. The current usage metrics is available 48-96 hours after online publication and is updated daily on week days.
Initial download of the metrics may take a while.