Fig. 6
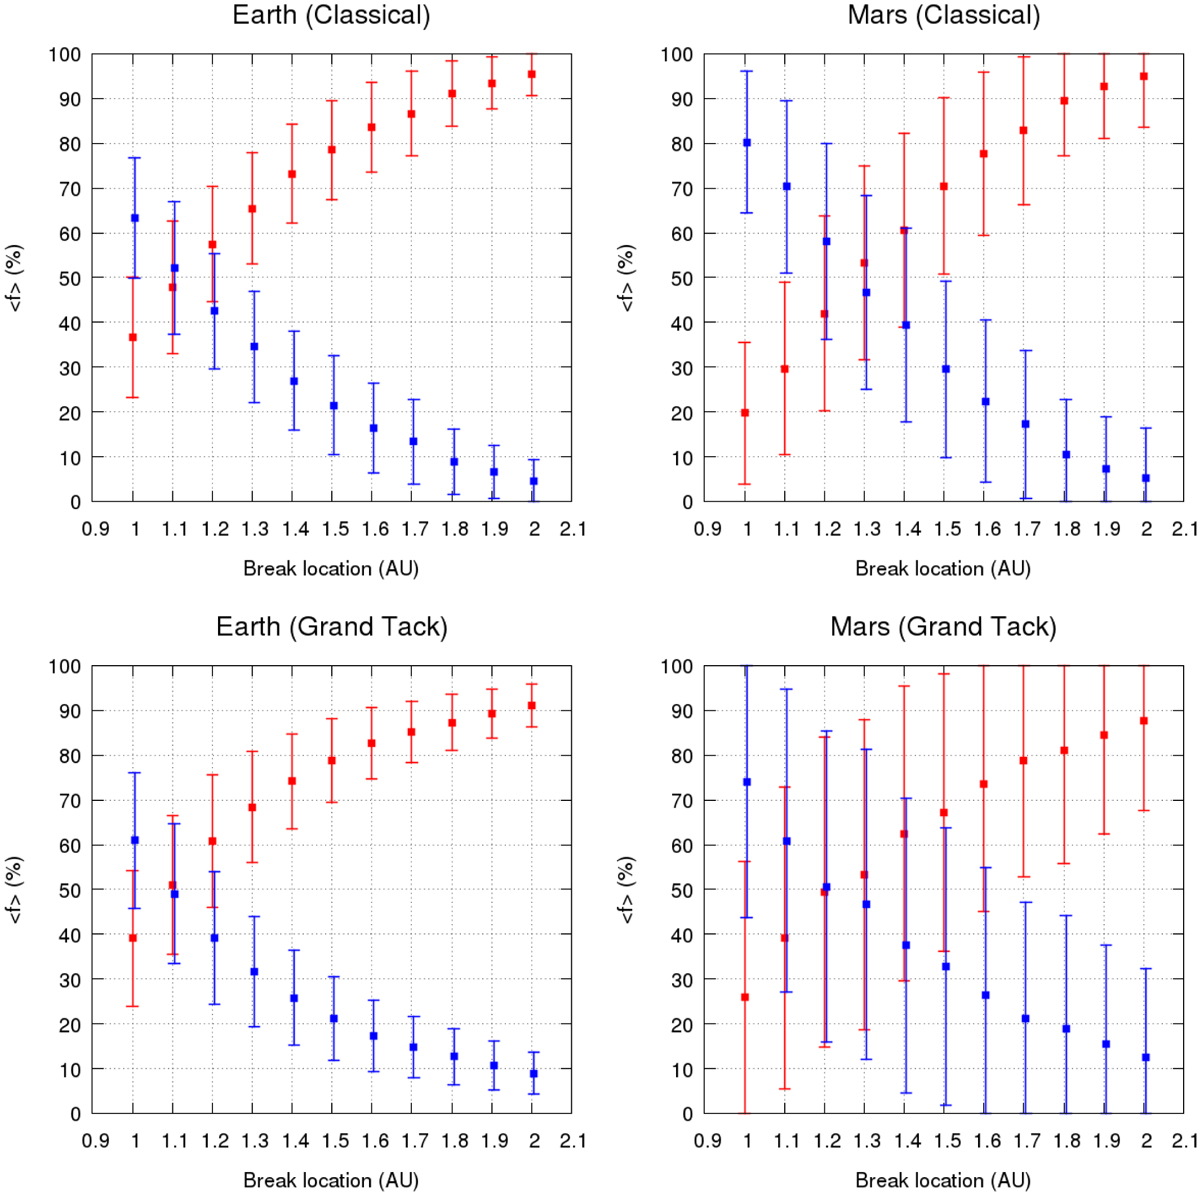
Average percentage contribution of enstatite chondrite (red) and ordinary chondrite (blue) to the bulk compositions of Earth and Mars. Data are plotted as a function of the distance where the initial solid disk changes its composition from enstatite chondrite to ordinary chondrite, which is defined as the break location of the disk. The error bars are ± 1σ. The two upper panels depict the average composition of Earth and Mars in the Classical model simulations. The two lower panelsshow the results from Grand Tack simulations with equal-mass initial conditions, which is similar to Fig. 7 of Brasser et al. (2017).
Current usage metrics show cumulative count of Article Views (full-text article views including HTML views, PDF and ePub downloads, according to the available data) and Abstracts Views on Vision4Press platform.
Data correspond to usage on the plateform after 2015. The current usage metrics is available 48-96 hours after online publication and is updated daily on week days.
Initial download of the metrics may take a while.