Fig. 1
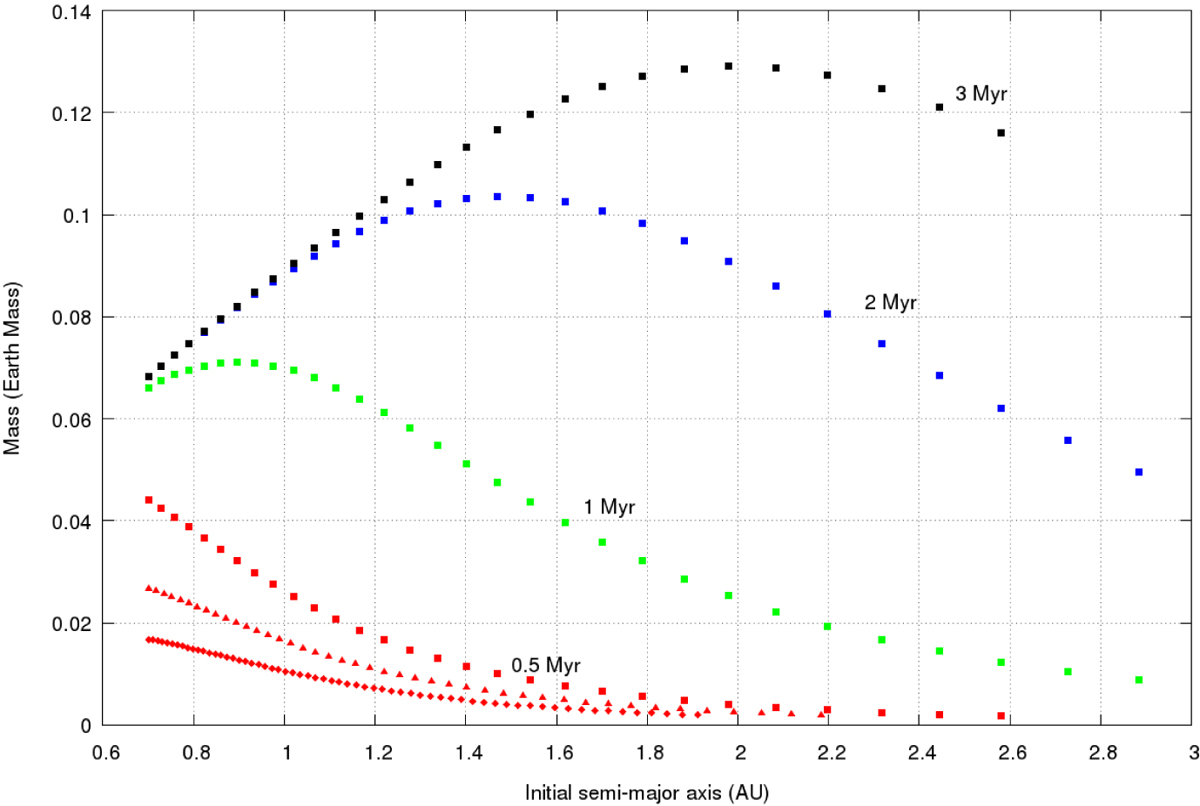
Initial masses of embryos against their initial semi-major axes for the oligarchic initial condition. The red points are embryos in a 0.5 Myr disk, green points are in a 1 Myr disk, blue points are in a 2 Myr disk, and black points are in a 3 Myr disk. Different point shapes represent different separation between adjacent embryos. Squares depict embryos separated by 10 RHill from each other, triangles are embryos with spacing of 7 RHill and rhombuses are embryos with spacing of 5 RHill. The comparison of different spacing between embryos is only plotted for the 0.5 Myr disk.
Current usage metrics show cumulative count of Article Views (full-text article views including HTML views, PDF and ePub downloads, according to the available data) and Abstracts Views on Vision4Press platform.
Data correspond to usage on the plateform after 2015. The current usage metrics is available 48-96 hours after online publication and is updated daily on week days.
Initial download of the metrics may take a while.