Free Access
Fig. 6.
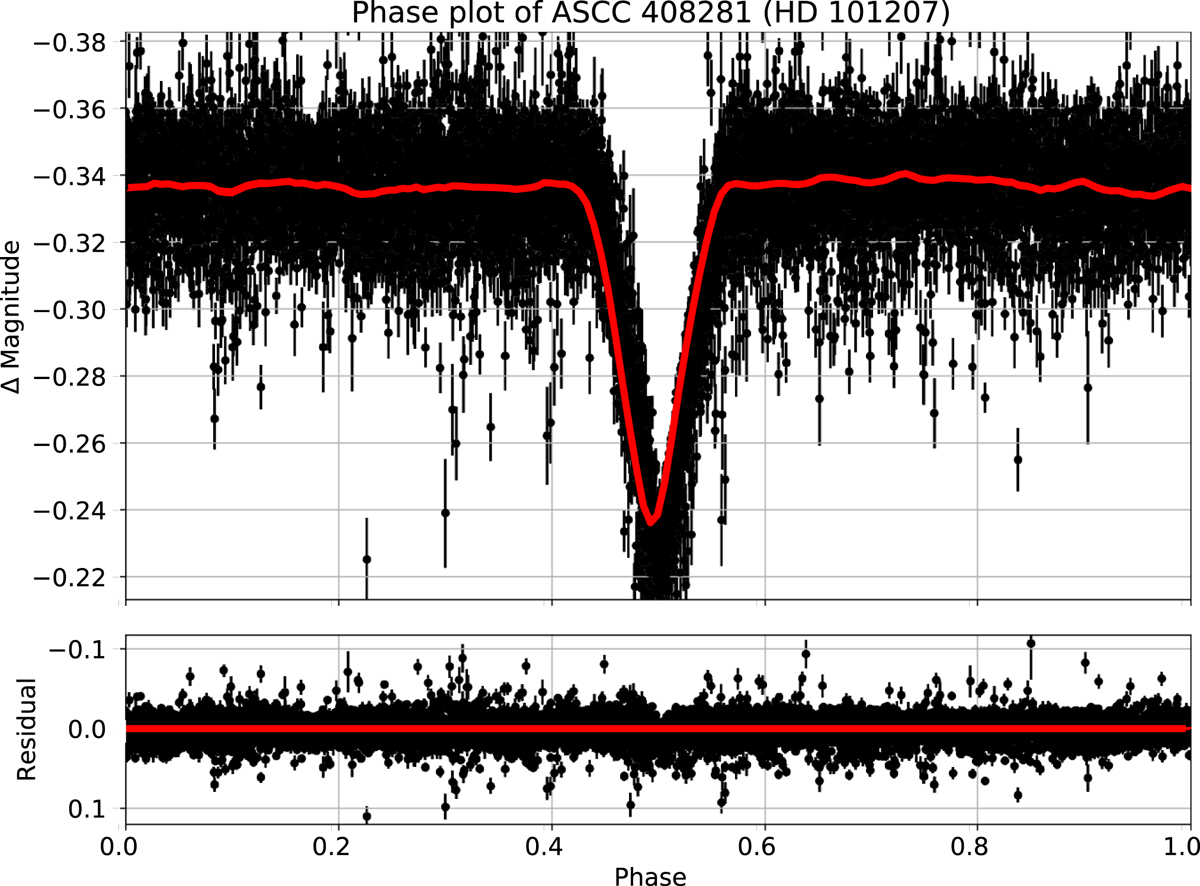
MASCARA light curve of ASCC 408281 (HD 101207), a previously suspected variable, which was detected with MASCARA, with a period of 1.09014(5) days. The red line is the running average over an 0.025 phase interval. The light curve clearly shows a single eclipse-like feature.
Current usage metrics show cumulative count of Article Views (full-text article views including HTML views, PDF and ePub downloads, according to the available data) and Abstracts Views on Vision4Press platform.
Data correspond to usage on the plateform after 2015. The current usage metrics is available 48-96 hours after online publication and is updated daily on week days.
Initial download of the metrics may take a while.