Fig. 3.
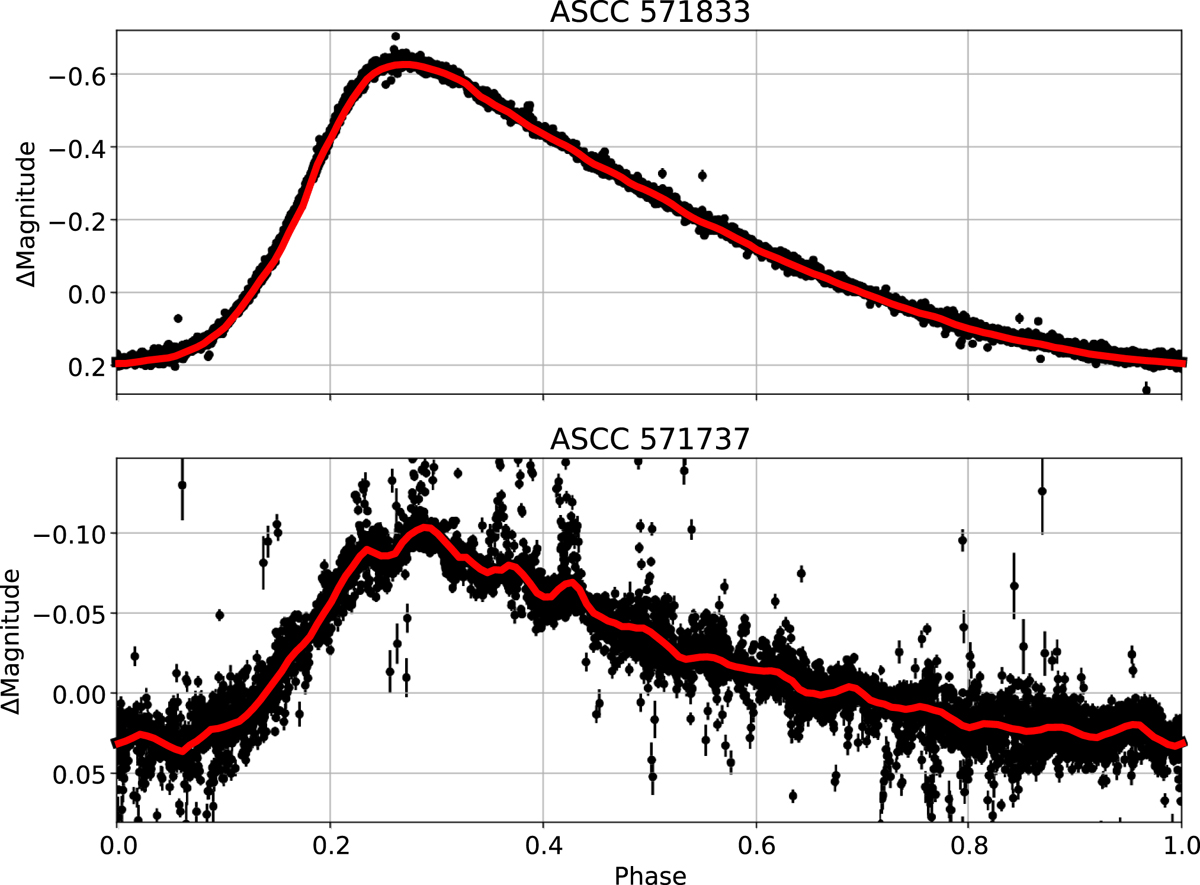
Comparison between light curves of ASCC 571833 (top panel; RT Aur) and ASCC 571737 (bottom panel; HD 45237), both phase folded with the same period P = 3.72816 days. The red line is the weighted mean; the magnitude axis zero-points are arbitrary. The period and shape of the light curves are similar but the amplitudes are different: 0.82 versus 0.13 magnitude. The variability seen in ASCC 571737 is completely caused by that in ASCC 571833.
Current usage metrics show cumulative count of Article Views (full-text article views including HTML views, PDF and ePub downloads, according to the available data) and Abstracts Views on Vision4Press platform.
Data correspond to usage on the plateform after 2015. The current usage metrics is available 48-96 hours after online publication and is updated daily on week days.
Initial download of the metrics may take a while.