Fig. 2.
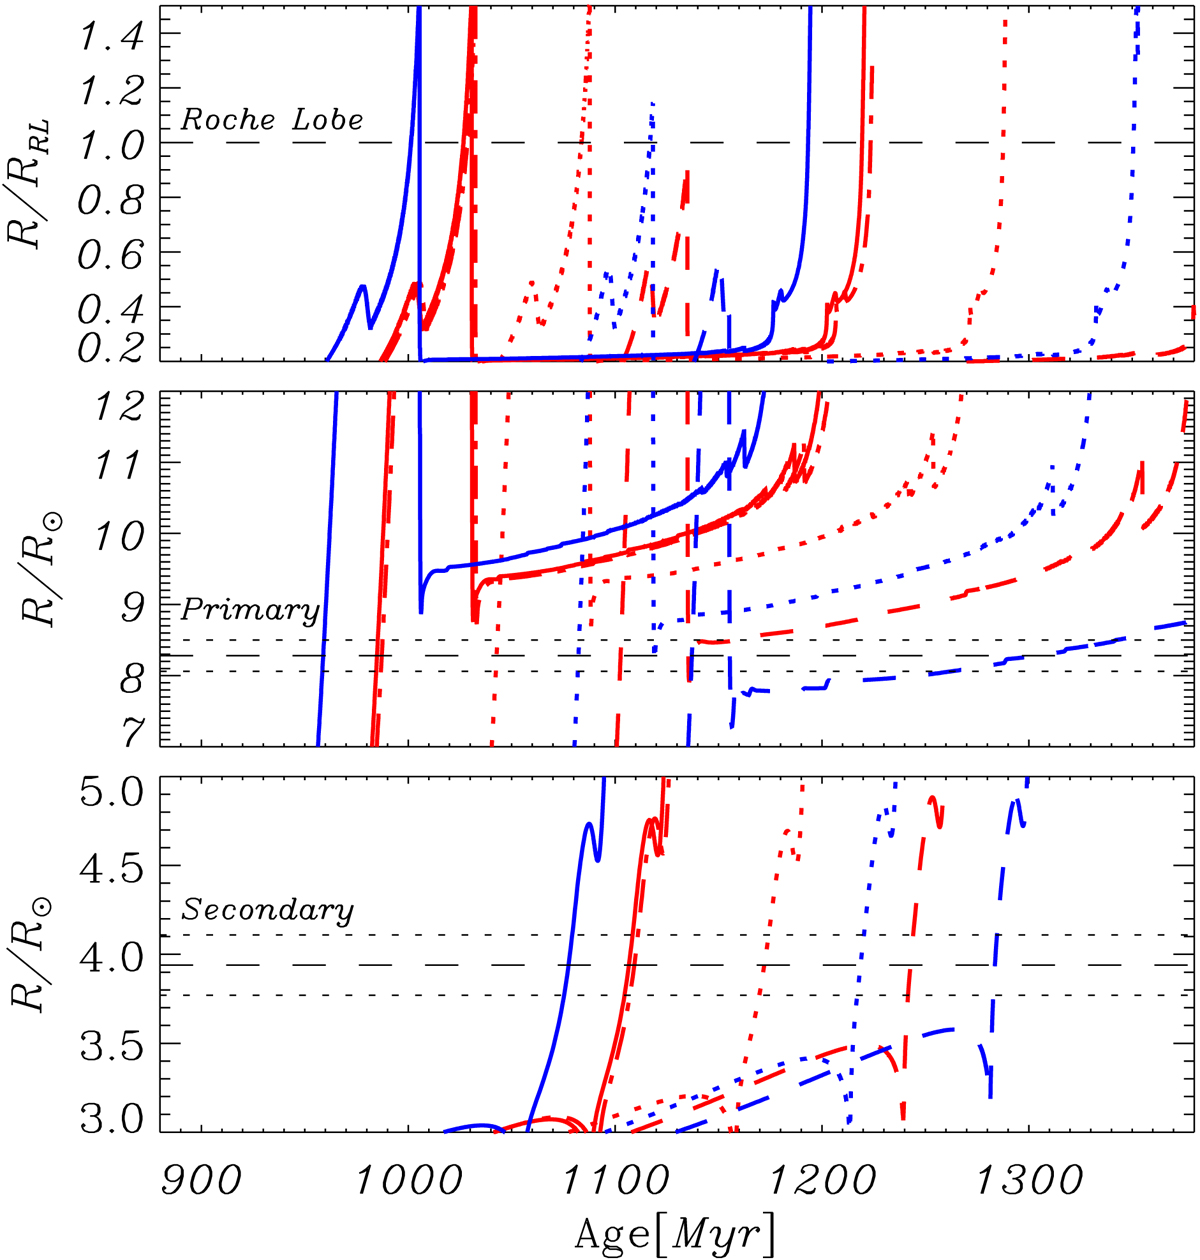
Evolution of the radii using the parameters given in Valle et al. (2017). The F and M models are shown in red and blue respectively. The F and M models numbered with I, II, and III are represented by solid, dotted, and dashed lines respectively. The F-I/II model is shown with a dashed dotted line. From top to bottom, the panels show the evolution of the primary’s radius relative to its Roche radius, and the primary and secondary radii. The corresponding observed radii including the error ranges are indicated by the horizontal grey long- and short-dashed lines
Current usage metrics show cumulative count of Article Views (full-text article views including HTML views, PDF and ePub downloads, according to the available data) and Abstracts Views on Vision4Press platform.
Data correspond to usage on the plateform after 2015. The current usage metrics is available 48-96 hours after online publication and is updated daily on week days.
Initial download of the metrics may take a while.