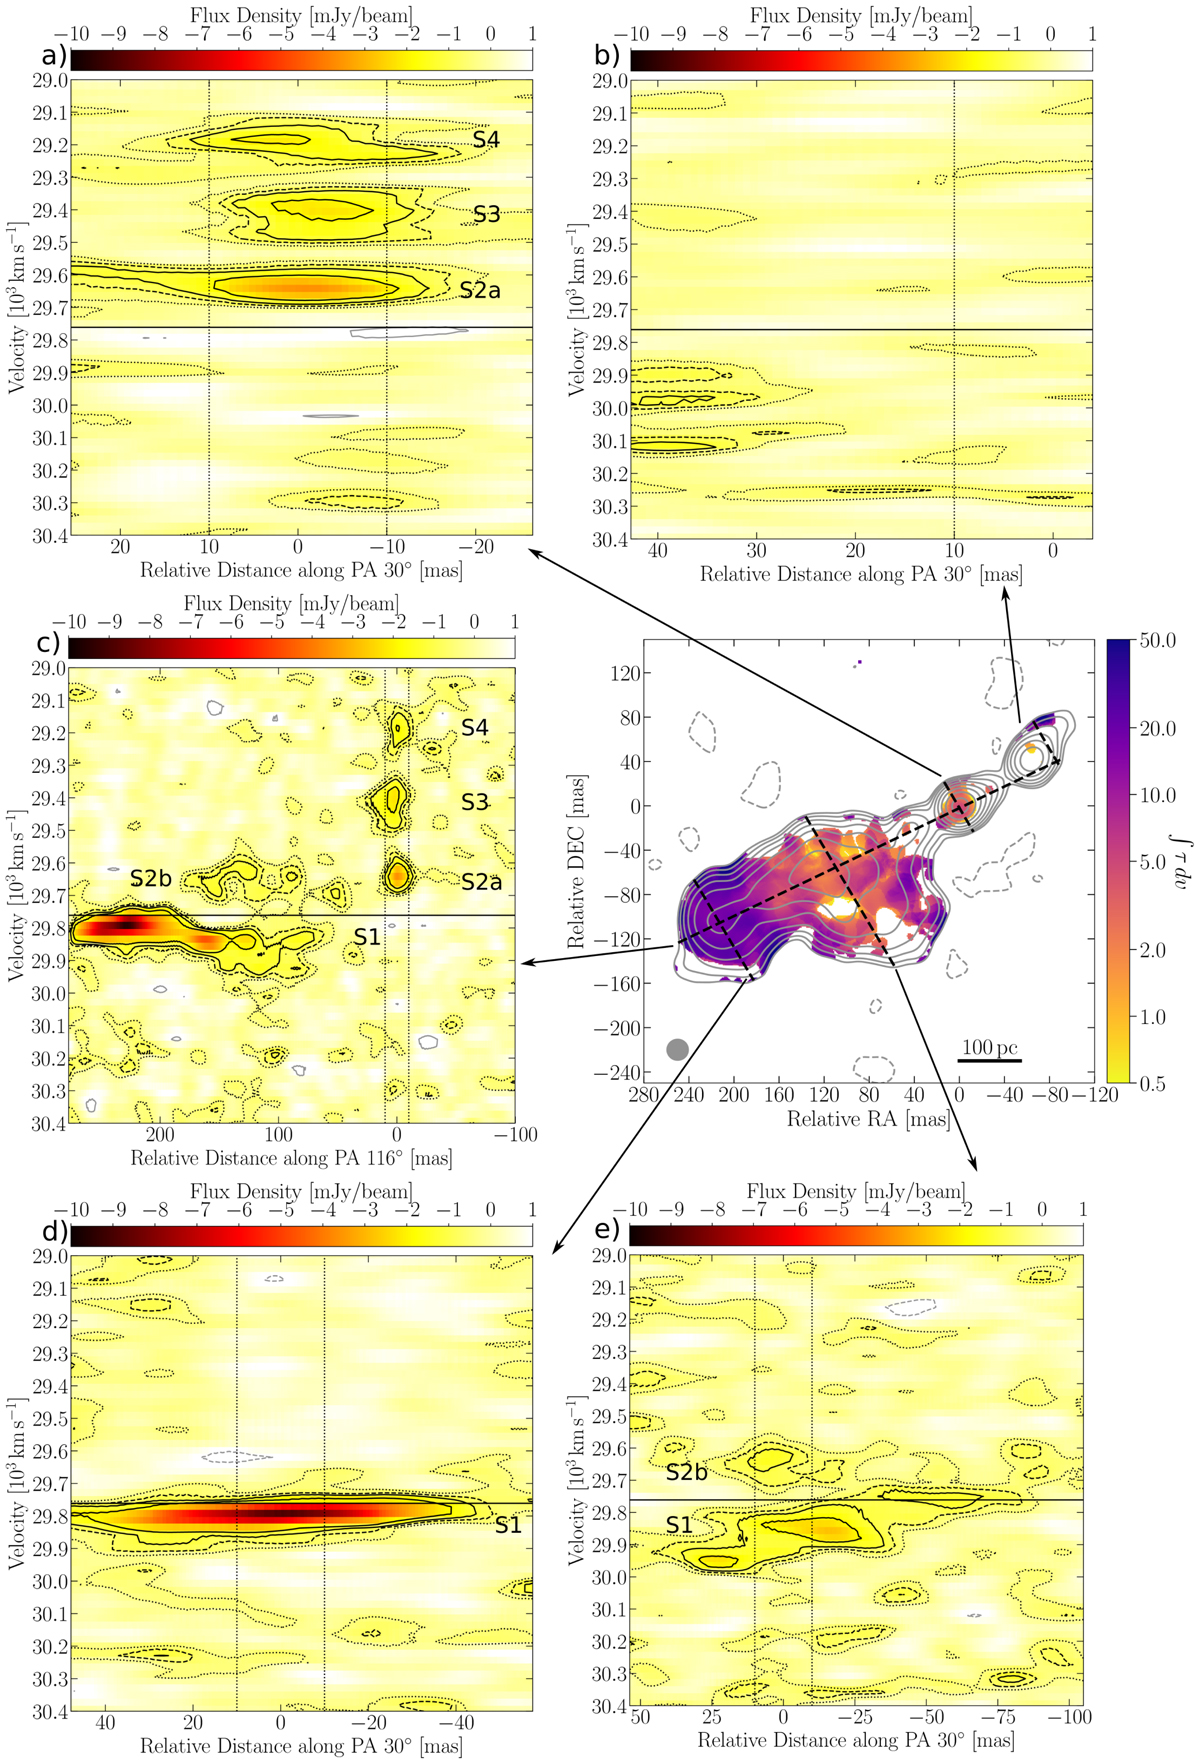
Fig. 4.

Position-velocity plots (panels a–e) from 29 000 to 30 400 km s−1 for slices along different position angles. The same color scale is applied to all position-velocity plots. The black dashed vertical lines mark the size of the synthesized beam for comparison, and the black solid horizontal line refers to the systemic velocity from Labiano et al. (2013). The black contour lines correspond to −1 (dotted lines), −2 (dashed lines), −3 and −5 (solid lines) times σVLBI, cube, and the solid gray contour line is set to 3σVLBI, cube. The central panel shows the slices and the optical depth integrated over the same velocity range as the position-velocity plots, but including only channels with ≤−3σVLBI, cube.
Current usage metrics show cumulative count of Article Views (full-text article views including HTML views, PDF and ePub downloads, according to the available data) and Abstracts Views on Vision4Press platform.
Data correspond to usage on the plateform after 2015. The current usage metrics is available 48-96 hours after online publication and is updated daily on week days.
Initial download of the metrics may take a while.


