Fig. 3.
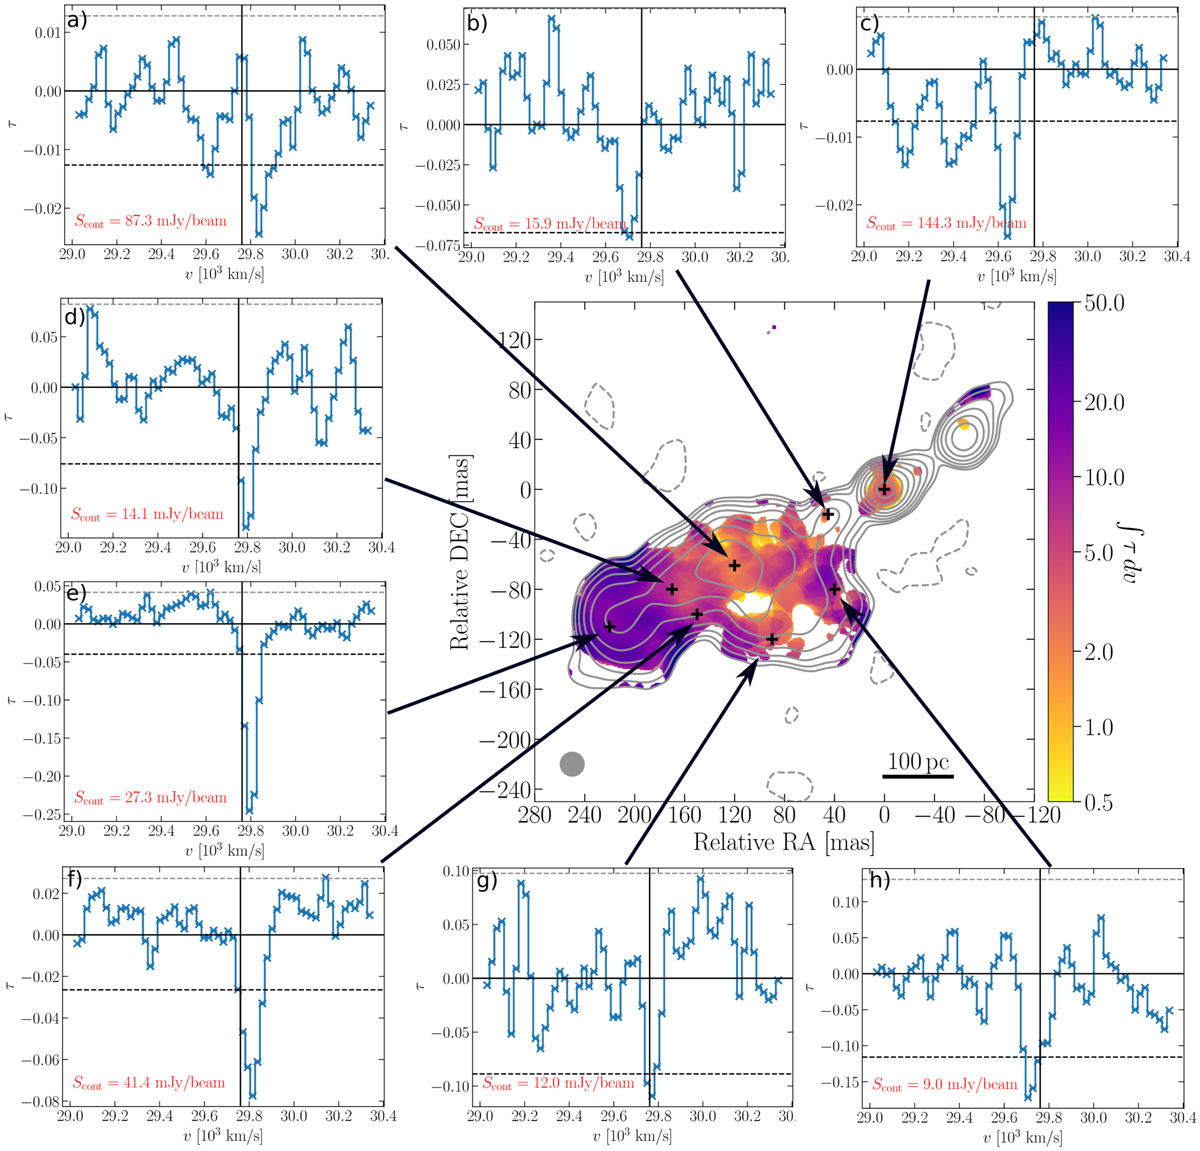
Central panel: continuum image of the central region of 3C 236 shown in Fig. 1. The contour lines start at 3σVLBI,cont and increase logarithmically by a factor of 2. Solid and dashed contour lines correspond to positive and negative flux density, respectively. The black crosses mark areas where the spectrum was extracted between 29 000–30 000 km s−1. Outer panels: optical depth spectrum shown as the ratio of the absorbed flux density to the continuum flux density. The dashed line represents the optical depth detection limit at the 3σVLBI,cube noise level. The solid vertical line marks the systemic velocity.
Current usage metrics show cumulative count of Article Views (full-text article views including HTML views, PDF and ePub downloads, according to the available data) and Abstracts Views on Vision4Press platform.
Data correspond to usage on the plateform after 2015. The current usage metrics is available 48-96 hours after online publication and is updated daily on week days.
Initial download of the metrics may take a while.