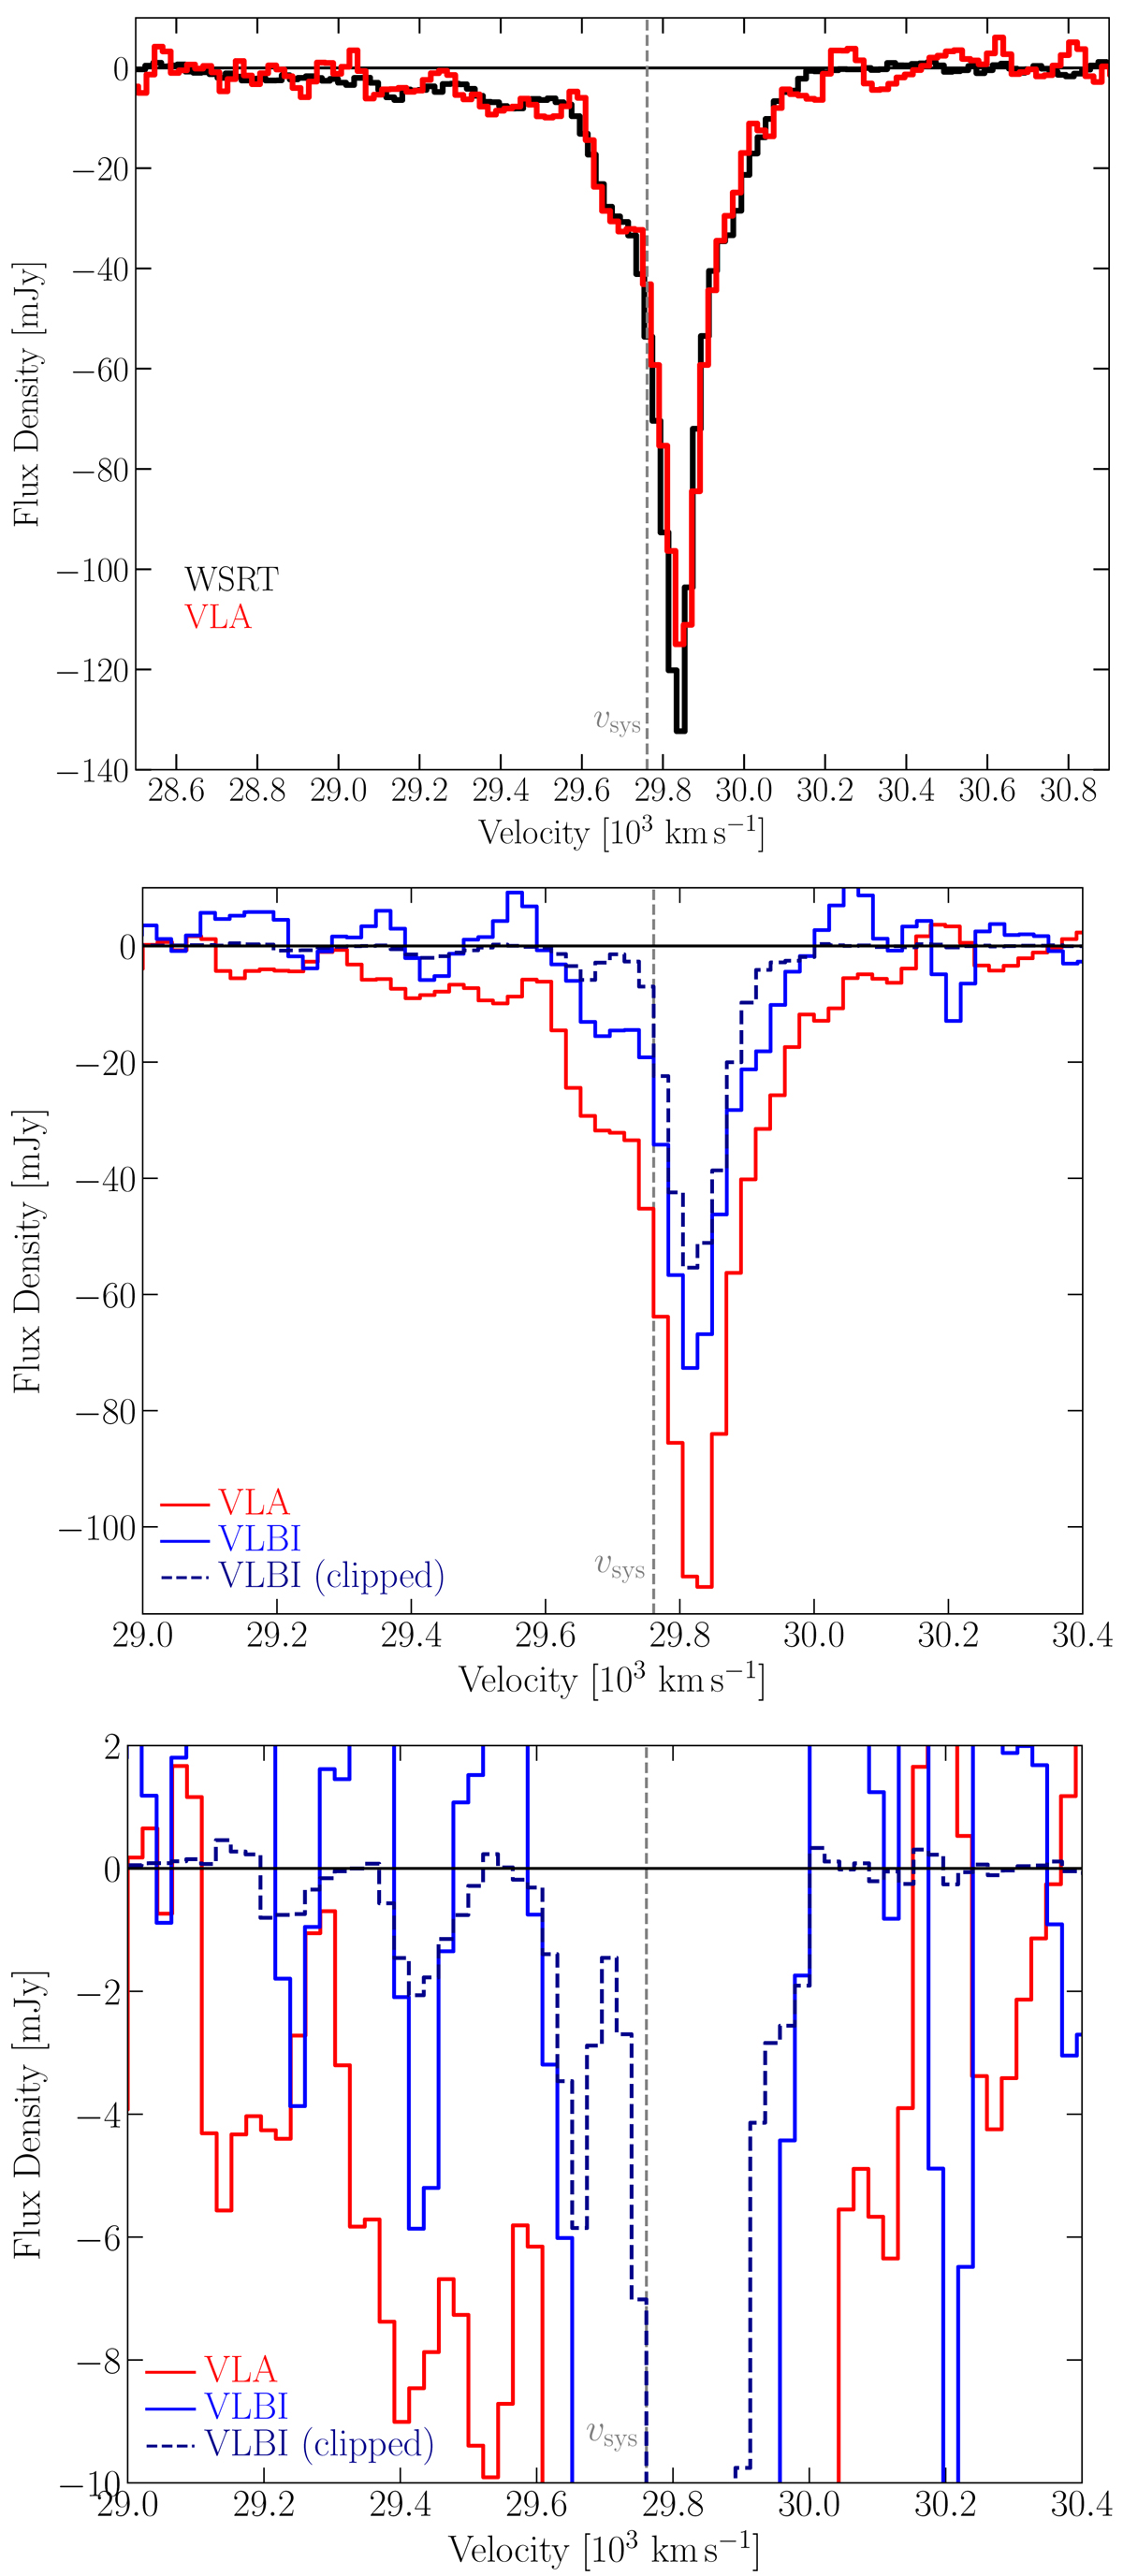
Fig. 2.

H I absorption spectra of 3C 236. The dashed vertical line marks the systemic velocity from Labiano et al. (2013). Top panel: WSRT (black) spectrum from Morganti et al. (2005b) and VLA (red) spectrum between 28 500 and 30 900 km s−1. Here, the velocity resolution of the VLA spectrum was matched to the WSRT data. Middle panel: spatially integrated VLBI with (dark blue, dashed) and without (blue, solid) clipping of the cube pixels at the 3σVLBI,Cube between 29 000 and 30 400 km s−1. For the VLA spectrum (red), the spectral resolution was matched to the VLBI spectrum. Bottom panel: same as the middle panel, but zoomed-in in flux density.
Current usage metrics show cumulative count of Article Views (full-text article views including HTML views, PDF and ePub downloads, according to the available data) and Abstracts Views on Vision4Press platform.
Data correspond to usage on the plateform after 2015. The current usage metrics is available 48-96 hours after online publication and is updated daily on week days.
Initial download of the metrics may take a while.


