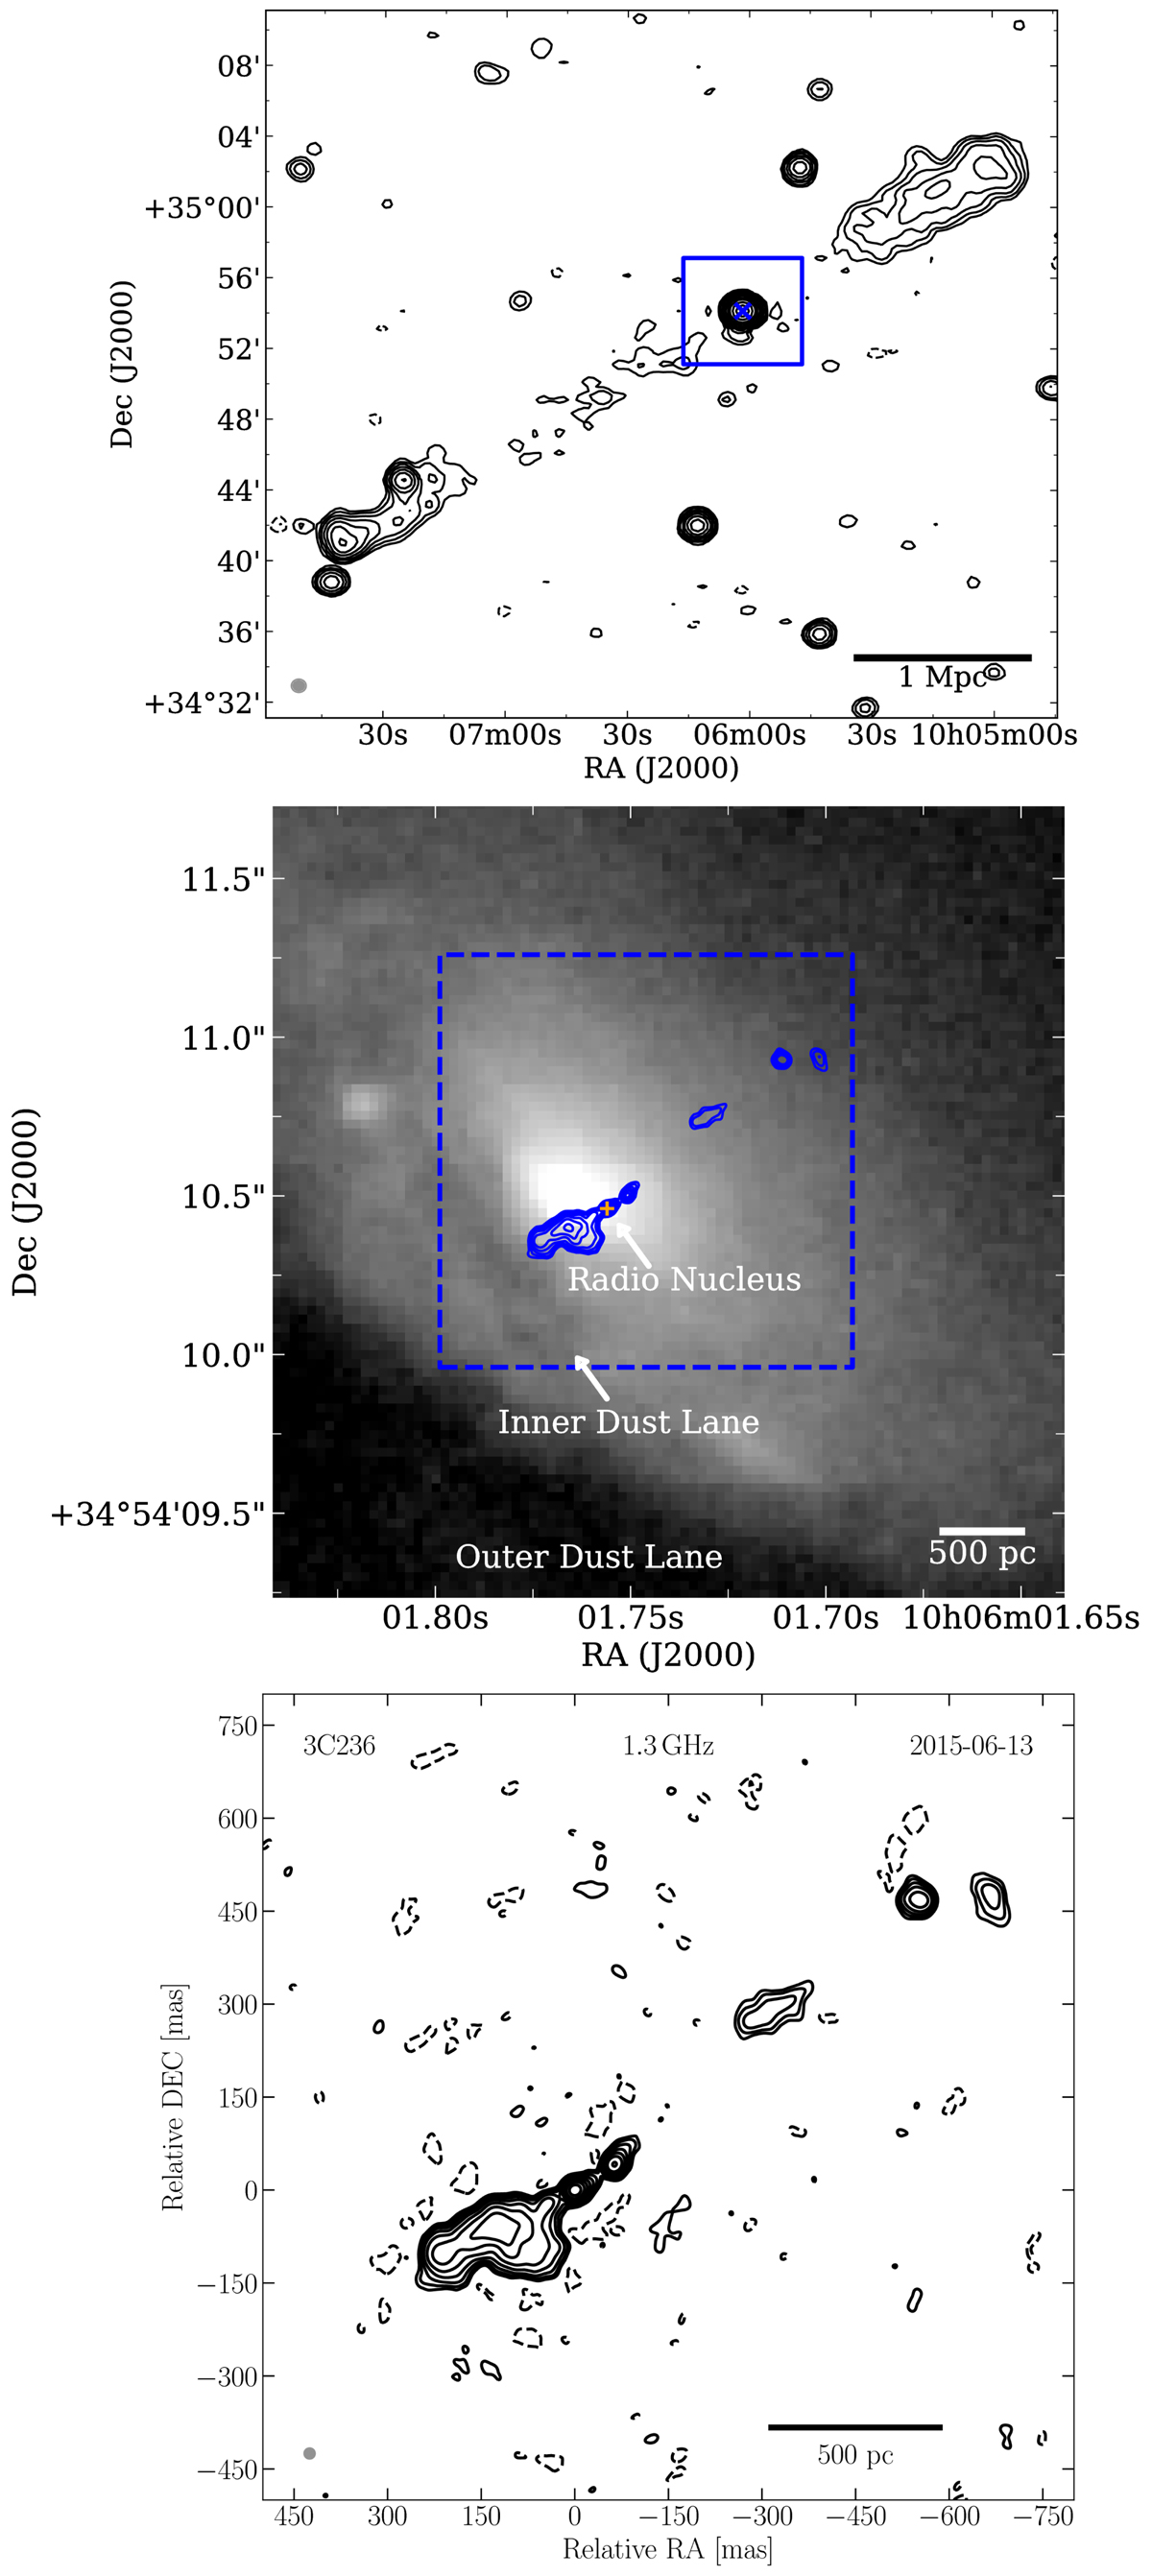
Fig. 1.

Left panel: 1.4 GHz VLA NVSS image of the large-scale radio emission of 3C 236 (Condon et al. 1998). The blue square and cross highlight the area covered by our VLA observation and the pointing of the VLBI observation, respectively. Middle panel: gray-colored background shows a zoom-in into an archival Hubble Space Telescope V-band image (ACS/HRC/F555W, O’Dea et al. 2001). The blue contour lines trace the VLBI radio continuum emission, starting for visibility at 5 × σnoise,VLBI. The orange cross marks the position of the VLBI core from Taylor et al. (2001) to which our VLBI image was aligned to in this montage. The dashed lines mark the plot range of the VLBI image shown in the bottom panel. Bottom panel: VLBI image obtained by our observation. The dashed and solid black contour lines trace negative and positive brightness starting from 3 × σnoise,VLBI and increasing logarithmically by a factor of 2.
Current usage metrics show cumulative count of Article Views (full-text article views including HTML views, PDF and ePub downloads, according to the available data) and Abstracts Views on Vision4Press platform.
Data correspond to usage on the plateform after 2015. The current usage metrics is available 48-96 hours after online publication and is updated daily on week days.
Initial download of the metrics may take a while.


