Fig. 6.
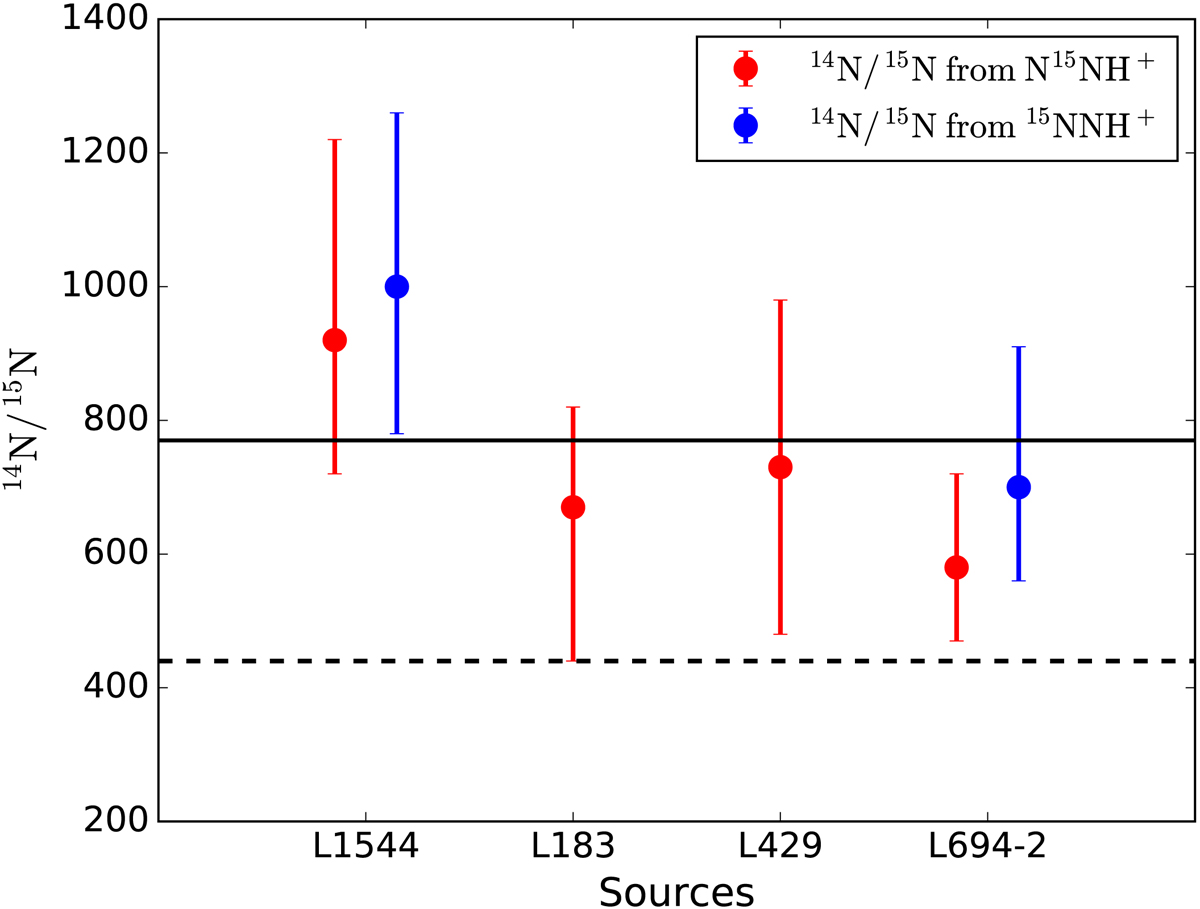
14N/15N values obtained in the sample presented in this paper and re-computed for L1544 with errorbars, determined with the method described in the main text. Red points refer to measurements of N15NH+, while blue ones of 15NNH+. The solid line represents the average value found in the whole sample (=770), while the dashed curve is the proto-solar nebula value (440).
Current usage metrics show cumulative count of Article Views (full-text article views including HTML views, PDF and ePub downloads, according to the available data) and Abstracts Views on Vision4Press platform.
Data correspond to usage on the plateform after 2015. The current usage metrics is available 48-96 hours after online publication and is updated daily on week days.
Initial download of the metrics may take a while.