Fig. 3.
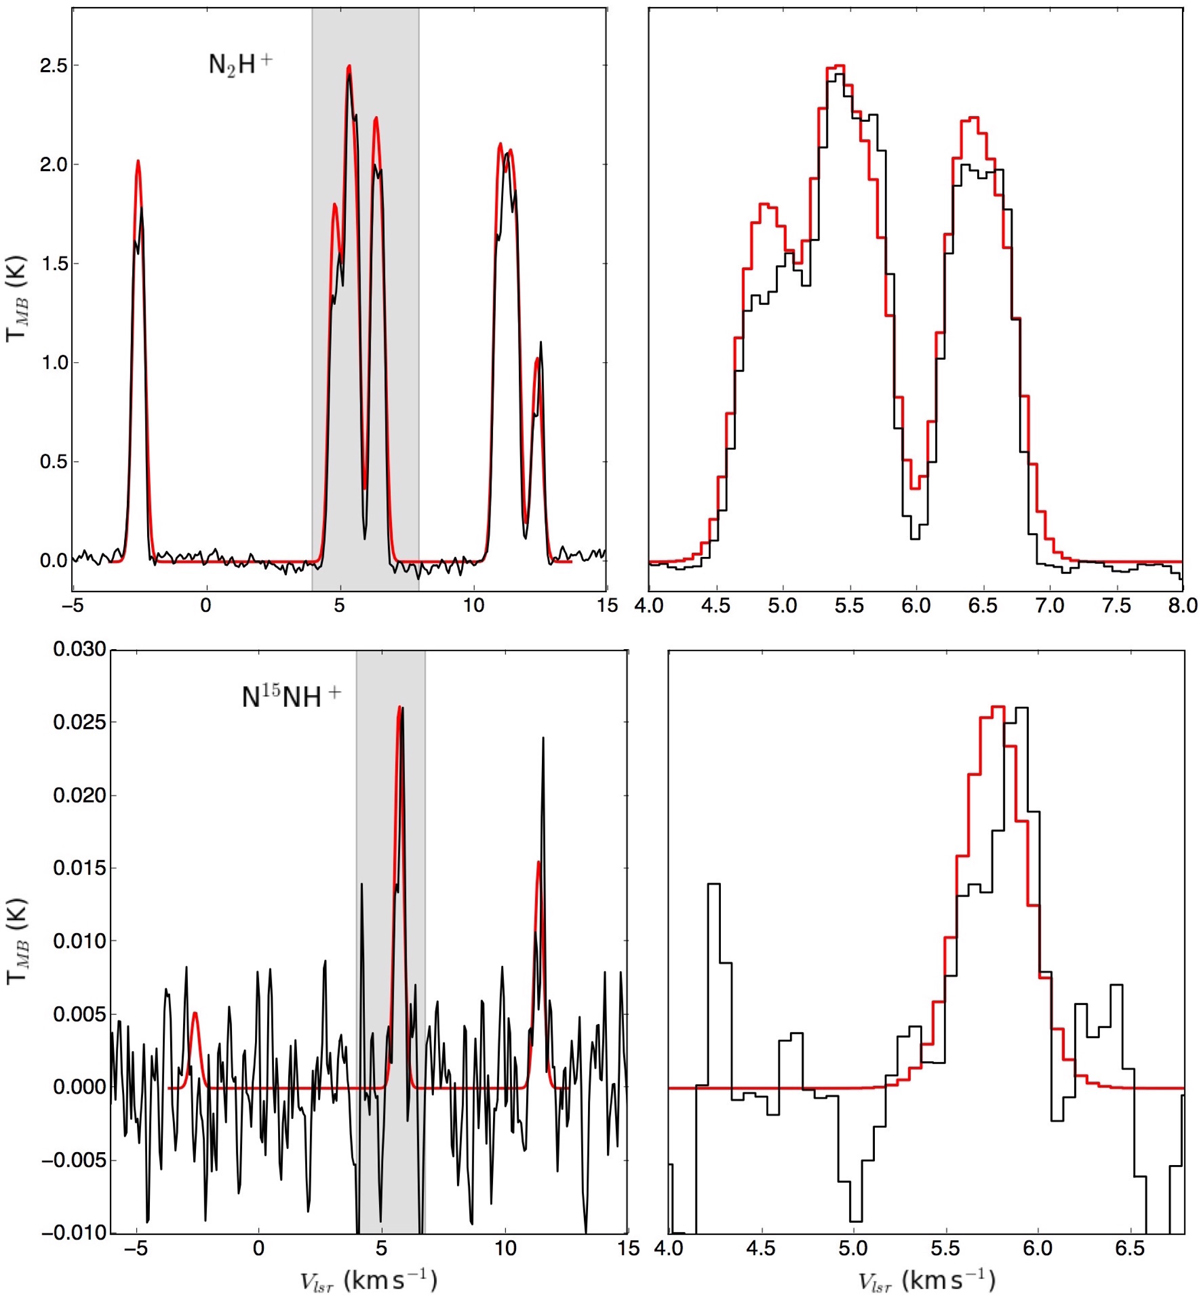
Observed spectra (black) and modelled ones (red) in L429, for N2H+ (top panels) and N15NH+ (bottom panels). The modelling was performed with MOLLIE as described in Sect. 4, and includes the infall velocity profile. The left panels show the entire acquired spectra, while the right ones are zoom-ins of the grey shaded velocity range.
Current usage metrics show cumulative count of Article Views (full-text article views including HTML views, PDF and ePub downloads, according to the available data) and Abstracts Views on Vision4Press platform.
Data correspond to usage on the plateform after 2015. The current usage metrics is available 48-96 hours after online publication and is updated daily on week days.
Initial download of the metrics may take a while.