Fig. 8.
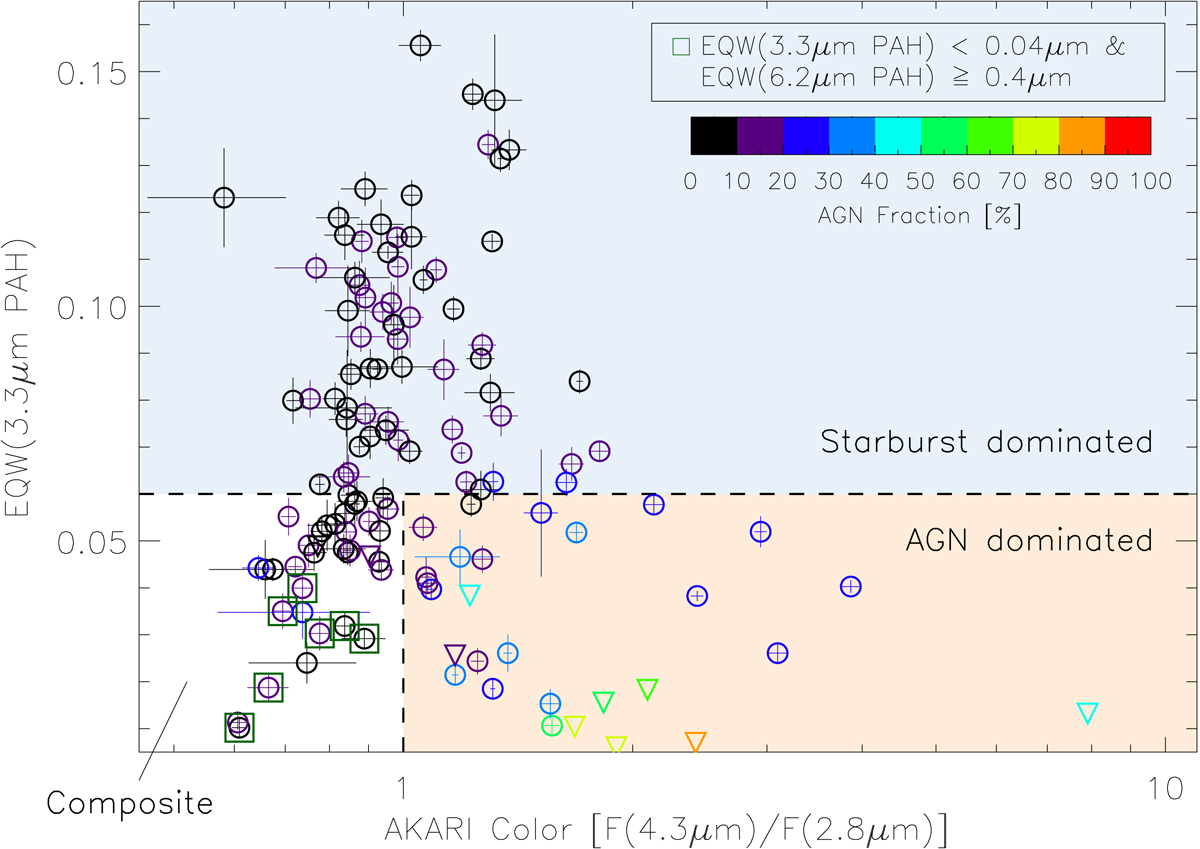
Revised starburst/AGN diagnostic diagram using 3.3 μm PAH EQW and Fν(4.3 μm)/Fν(2.8 μm). The symbols are the same as in Fig. 2. The blue and beige areas are the regions we propose for identifying LIRGs whose infrared continuum emission is dominated by starbursts or AGN, respectively (see also Eqs. (1) and (2)). The white area denotes composite sources (Eq. (3)).
Current usage metrics show cumulative count of Article Views (full-text article views including HTML views, PDF and ePub downloads, according to the available data) and Abstracts Views on Vision4Press platform.
Data correspond to usage on the plateform after 2015. The current usage metrics is available 48-96 hours after online publication and is updated daily on week days.
Initial download of the metrics may take a while.