Fig. 7.
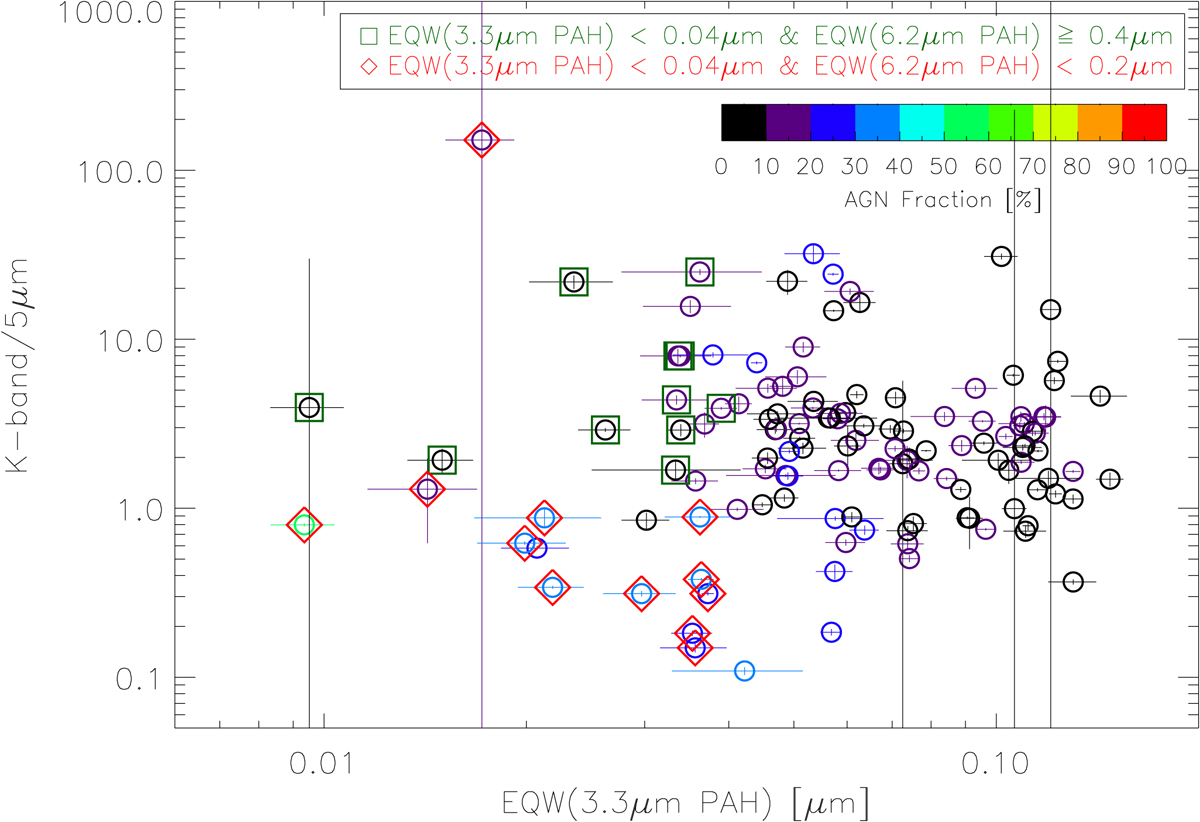
Ratio of 2MASS K-band to 5 μm monochromatic continuum emission as a function of 3.3 μm PAH EQW. The EQWs are derived from the AKARI spectra extracted with an aperture covering ∼95% of the total AKARI flux. The K-band emission is measured in the imaging data using the same aperture size. The symbols are the same as in Fig. 2, in addition to the red diamonds, which indicate PAH3.3 μm EQW < 0.04 μm and PAH6.2 μm EQW < 0.4 μm.
Current usage metrics show cumulative count of Article Views (full-text article views including HTML views, PDF and ePub downloads, according to the available data) and Abstracts Views on Vision4Press platform.
Data correspond to usage on the plateform after 2015. The current usage metrics is available 48-96 hours after online publication and is updated daily on week days.
Initial download of the metrics may take a while.