Fig. 5.
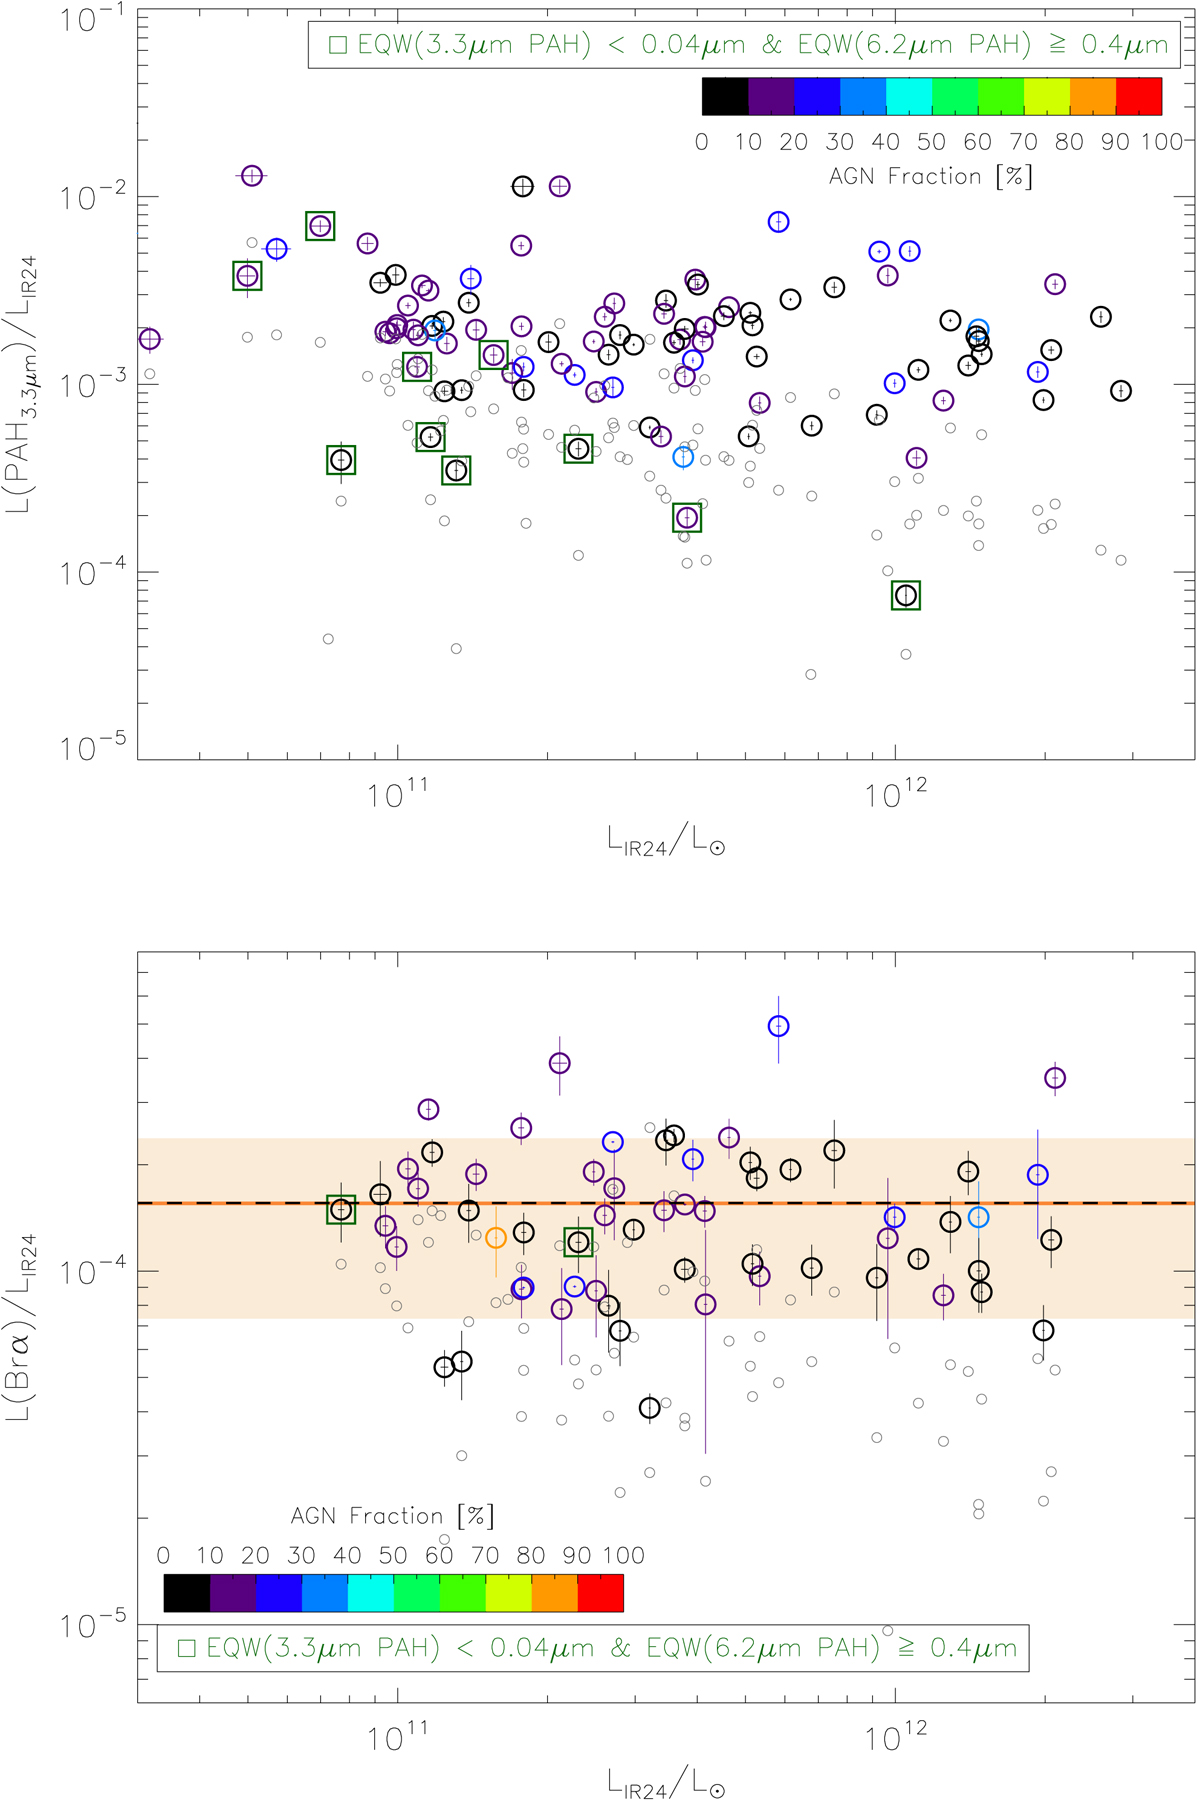
Top: ratio of L3.3 μm PAH to LIR 24 as a function of LIR 24. The 3.3 μm PAH emission is measured from the AKARI spectra extracted with the aperture that covers ∼95% of the total flux in the AKARI 2D spectra. We use LIR 24 to denote the total infrared luminosity, scaled by the flux ratio of the Spitzer/MIPS 24 μm emission within the AKARI aperture to the total 24 μm flux (see Sect. 4.3 for more details). The sources with the detected emission feature are shown by the circles. The small gray circles denote the values without the dust extinction correction. The large circles are color-coded by the AGN fraction. The green squares represent the sources with PAH3.3 μm EQW < 0.04 μm and PAH 6.2 μm EQW ≥ 0.4 μm. Bottom: ratio of measured (gray) and corrected (colored) Brα to the infrared luminosity as a function of LIR 24. The horizontal orange solid line and shaded area indicate the mean and its standard deviation of the extinction corrected LBrα/LIR 24, respectively. The horizontal black dashed line indicates LBrα/LIR = 1.56 × 10⁻⁴ when the SFRs derived from LBrα and LIR 24 are the same.
Current usage metrics show cumulative count of Article Views (full-text article views including HTML views, PDF and ePub downloads, according to the available data) and Abstracts Views on Vision4Press platform.
Data correspond to usage on the plateform after 2015. The current usage metrics is available 48-96 hours after online publication and is updated daily on week days.
Initial download of the metrics may take a while.