Fig. 4.
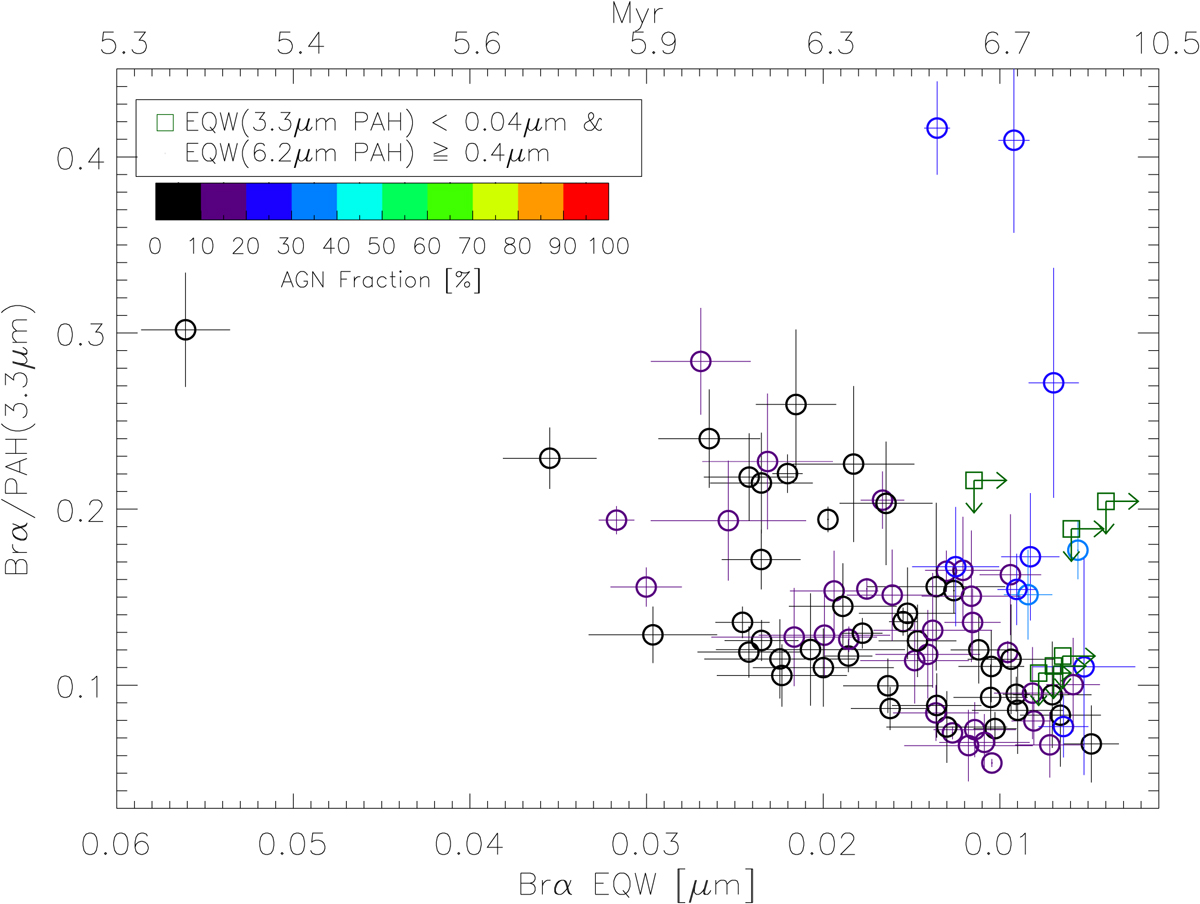
Ratio of Brα to 3.3 μm PAH emission as a function of decreasing Brα EQW (increasing starburst age, the upper x-axis). The circles represent the sources with both 3.3 μm PAH and Brα detections color-coded by the AGN fraction. The upper limits are shown only for the objects with PAH3.3 μm EQW < 0.04 μm and PAH6.2 μm EQW ≥ 0.4 μm. The starburst ages are derived from the Brα EQW using the Starburst99 models (Leitherer et al. 1999, 2010; Vázquez & Leitherer 2005).
Current usage metrics show cumulative count of Article Views (full-text article views including HTML views, PDF and ePub downloads, according to the available data) and Abstracts Views on Vision4Press platform.
Data correspond to usage on the plateform after 2015. The current usage metrics is available 48-96 hours after online publication and is updated daily on week days.
Initial download of the metrics may take a while.