Fig. 3.
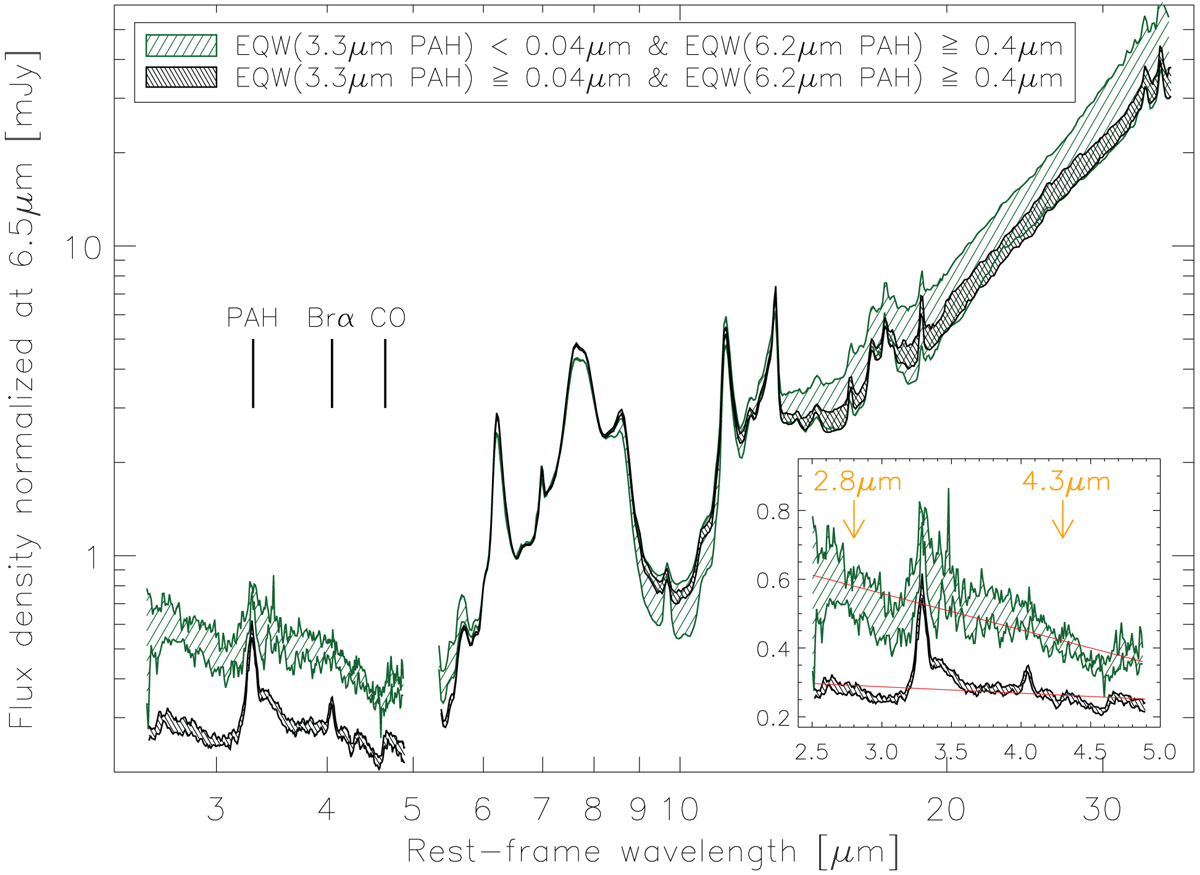
Median spectra of sources with PAH6.2 μm EQW ≥ 0.4 μm, and PAH3.3 μm EQW < 0.04 μm (green; seven objects) or 3.3 μm PAH EQW ≥ 0.04 μm (black; 79 objects). The ranges of the spectra are 1σ uncertainties of the estimated median values. The inset panel shows a zoom-in of the 2.5–5 μm region with the continuum fits in red. The orange arrows indicate the wavelengths where the AKARI continuum color, Fν(4.3 μm)/Fν(2.8 μm), is measured.
Current usage metrics show cumulative count of Article Views (full-text article views including HTML views, PDF and ePub downloads, according to the available data) and Abstracts Views on Vision4Press platform.
Data correspond to usage on the plateform after 2015. The current usage metrics is available 48-96 hours after online publication and is updated daily on week days.
Initial download of the metrics may take a while.