Fig. 2.
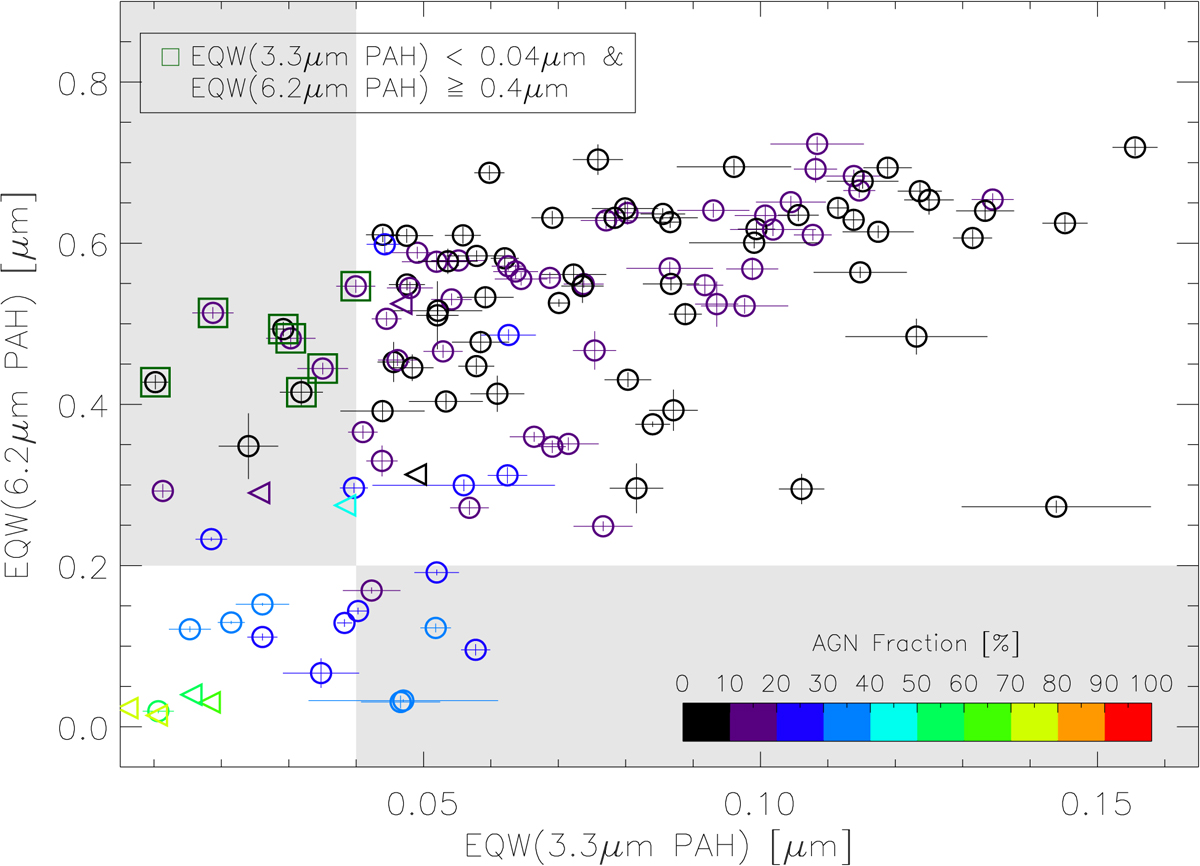
Comparison between AKARI 3.3 μm PAH EQW and Spitzer/IRS 6.2 μm PAH EQW of the GOALS LIRG sample. The circles represent the sources with detections of both PAH features, whereas the left-pointing triangles represent detections of the 6.2 μm PAH but upper limits for the 3.3 μm PAH. The symbols are color-coded by the AGN bolometric fraction in the mid-infrared (Sect. 4.1; Díaz-Santos et al. 2017), which is indicated by the color bar shown in the bottom right. Galaxies with PAH3.3 μm EQW < 0.04 μm and PAH6.2 μm EQW ≥ 0.4 μm are also highlighted by the green squares. The gray regions are the areas where the implied galactic energy source (starburst or AGN) disagrees between 3.3 μm PAH EQW and 6.2 μm PAH EQW (high 3.3 μm PAH EQW but low 6.2 μm PAH EQW, or vice versa).
Current usage metrics show cumulative count of Article Views (full-text article views including HTML views, PDF and ePub downloads, according to the available data) and Abstracts Views on Vision4Press platform.
Data correspond to usage on the plateform after 2015. The current usage metrics is available 48-96 hours after online publication and is updated daily on week days.
Initial download of the metrics may take a while.