Open Access
Fig. A.1.
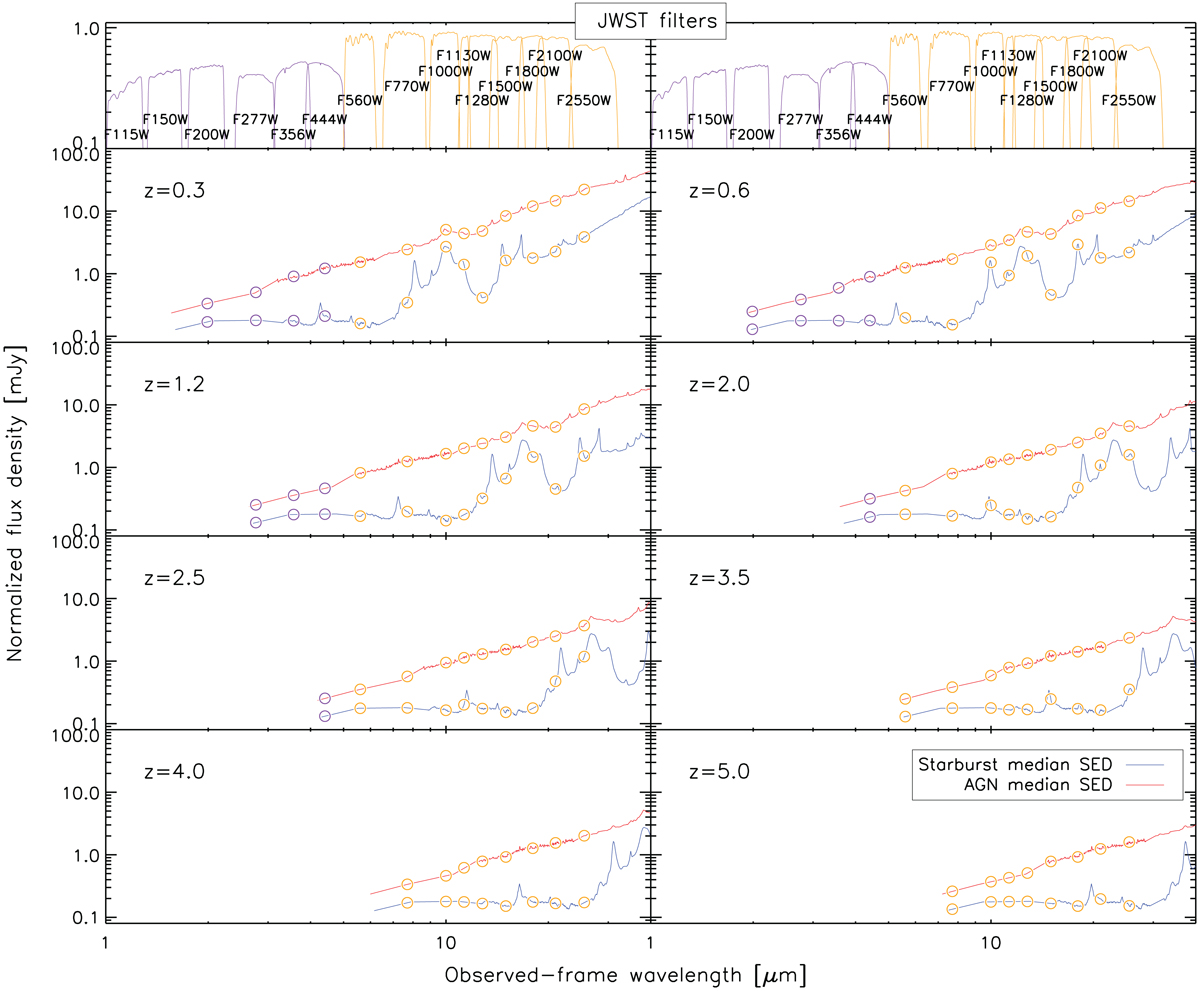
Same plots as Fig. 9, but the SEDs are redshifted from z = 0.3 to 5.0 as indicated in each panel. The orange circles on each SED indicate the locations of the effective wavelengths of the JWST filters shown in the upper most panels.
Current usage metrics show cumulative count of Article Views (full-text article views including HTML views, PDF and ePub downloads, according to the available data) and Abstracts Views on Vision4Press platform.
Data correspond to usage on the plateform after 2015. The current usage metrics is available 48-96 hours after online publication and is updated daily on week days.
Initial download of the metrics may take a while.