Fig. 12.
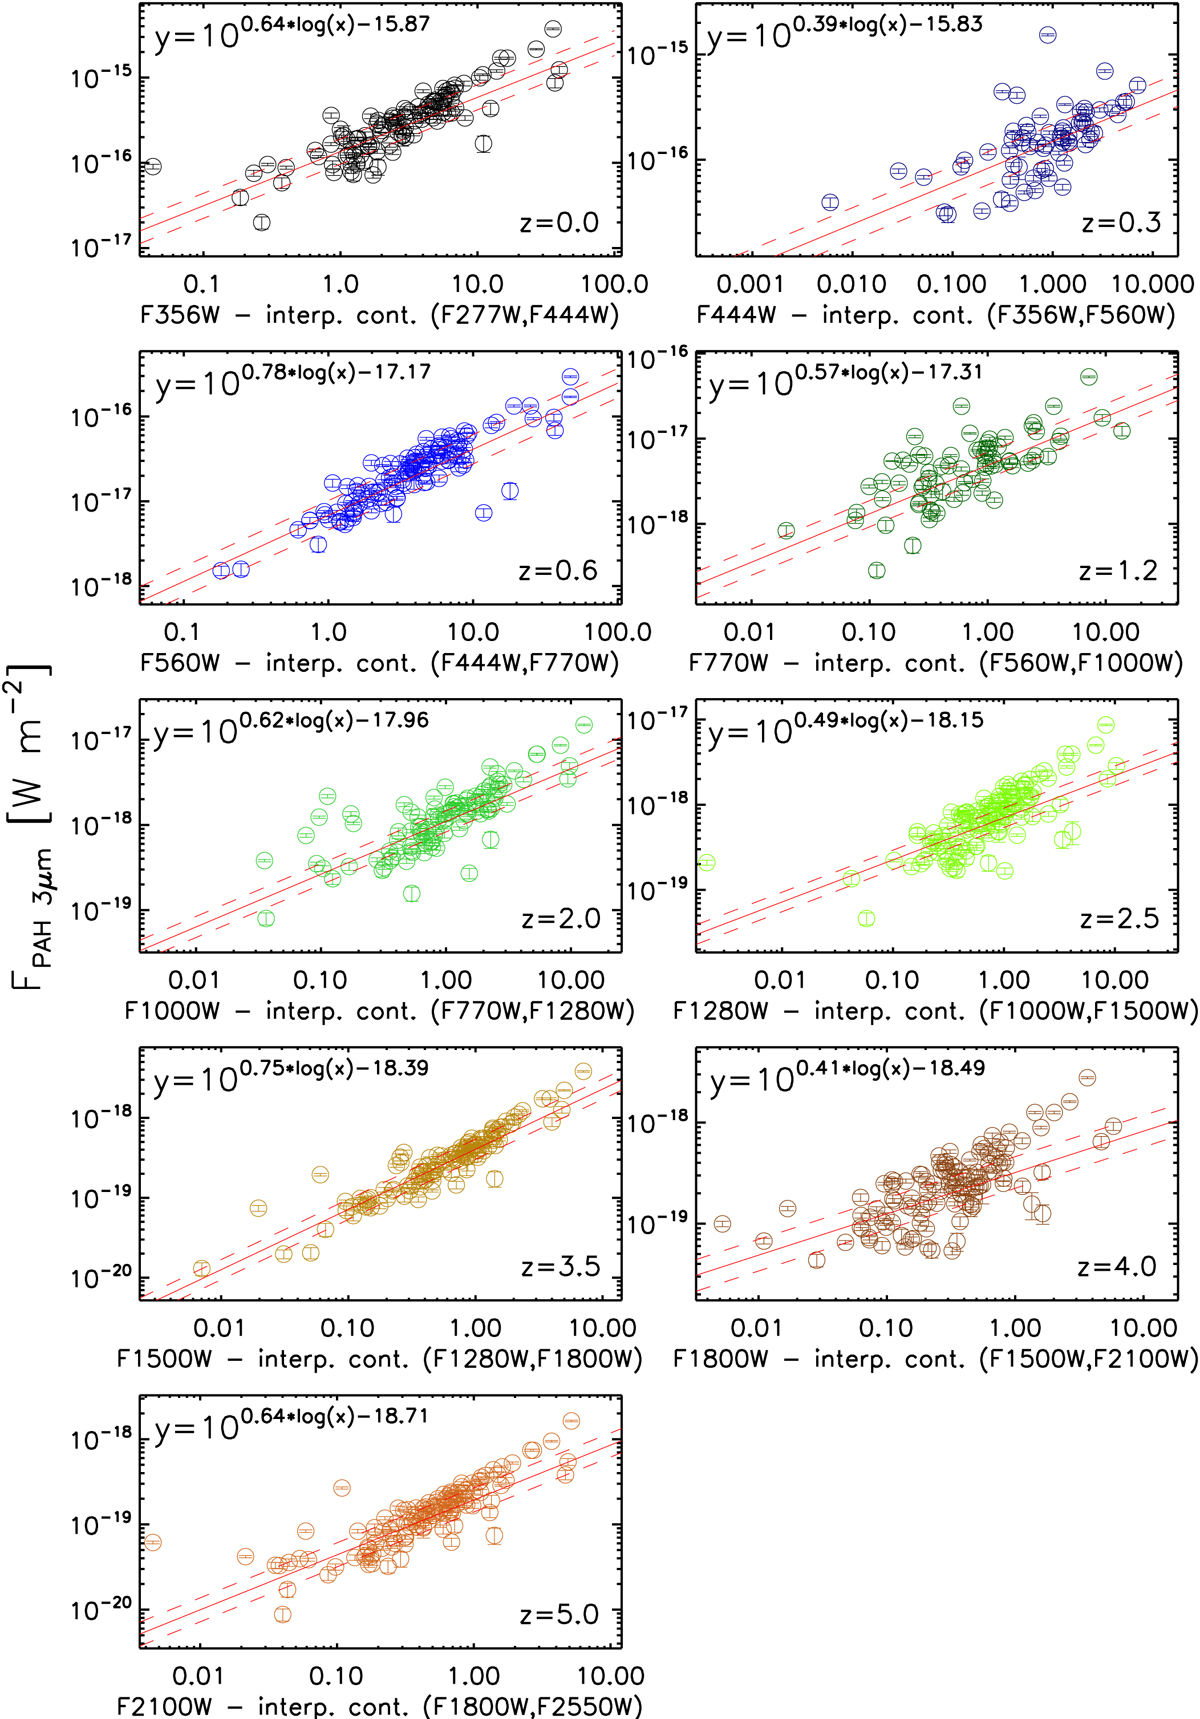
PAH3.3 um fluxes obtained in AKARI spectra compared with an estimate of the 3.3 μm PAH fluxes using three JWST broadband filters from z = 0 to 5.0. At z = 0, the 3.3 μm PAH fluxes are the actual measurements from the AKARI spectra, while for higher redshifts, they are manually scaled to the expected 3.3 μm PAH fluxes of high-z ULIRGs (see text for more details). The broadband estimated PAH fluxes are indicated by the difference between the spectro-photometry in the filter covering the 3.3 μm PAH feature and its local continuum calculated by the linear interpolation of its two neighboring filters. The red solid and dashed lines indicate the best fit line (shown at the top left in each panel) and its 1σ uncertainty, respectively.
Current usage metrics show cumulative count of Article Views (full-text article views including HTML views, PDF and ePub downloads, according to the available data) and Abstracts Views on Vision4Press platform.
Data correspond to usage on the plateform after 2015. The current usage metrics is available 48-96 hours after online publication and is updated daily on week days.
Initial download of the metrics may take a while.