Fig. 11.
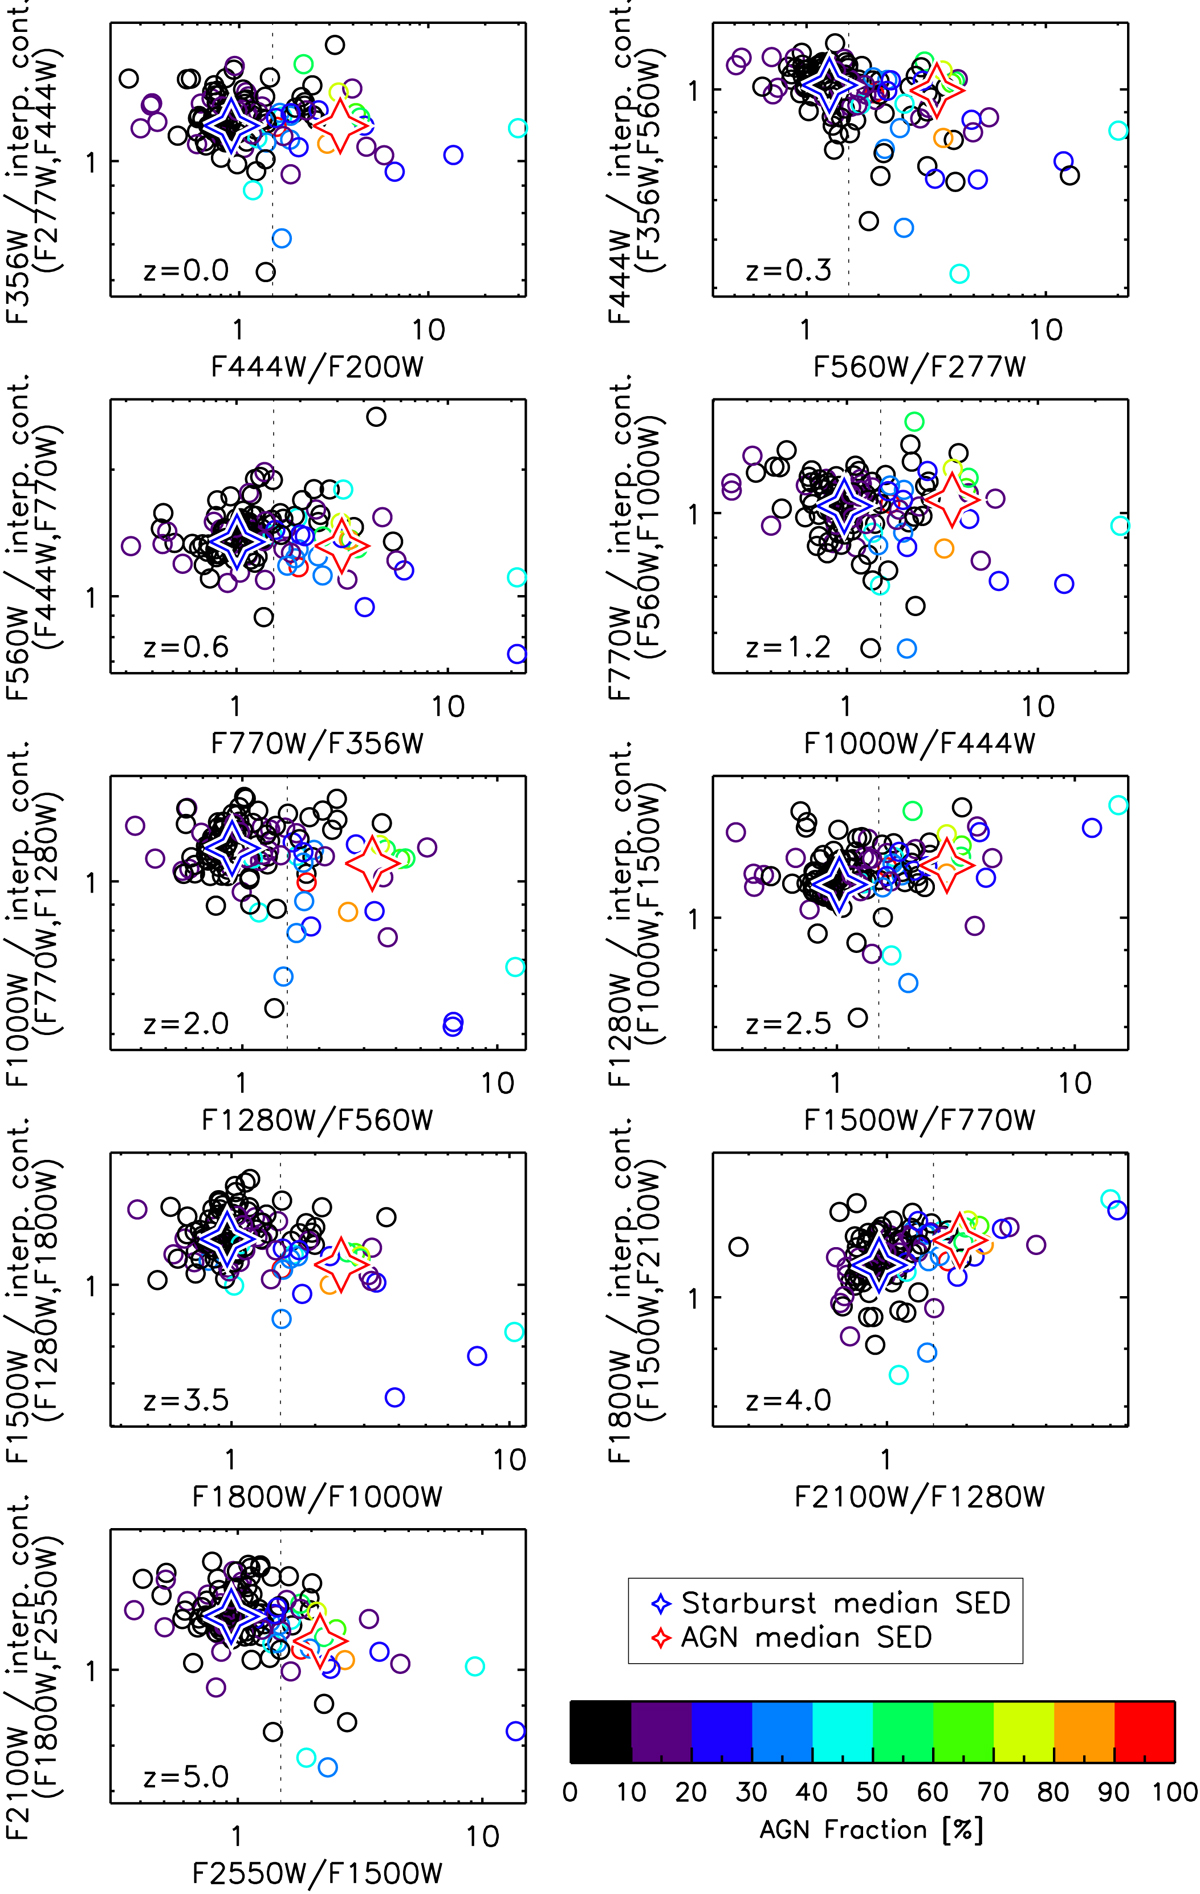
AGN/starburst diagnostic diagrams at each of the redshifts indicated at the bottom left of each panel. The y-axis represents 3.3 μm PAH EQW by taking the flux ratio of the filter covering the 3.3 μm PAH feature to the estimated local continuum emission via a linear interpolation between the two bracketing filters. The x-axis is a measure of hot dust emission. The symbols are the same as in Fig. 10. The vertical dotted line at the colors of 1.5 in each panel indicates an empirical cut for selecting starburst-dominated galaxies.
Current usage metrics show cumulative count of Article Views (full-text article views including HTML views, PDF and ePub downloads, according to the available data) and Abstracts Views on Vision4Press platform.
Data correspond to usage on the plateform after 2015. The current usage metrics is available 48-96 hours after online publication and is updated daily on week days.
Initial download of the metrics may take a while.