Fig. 10.
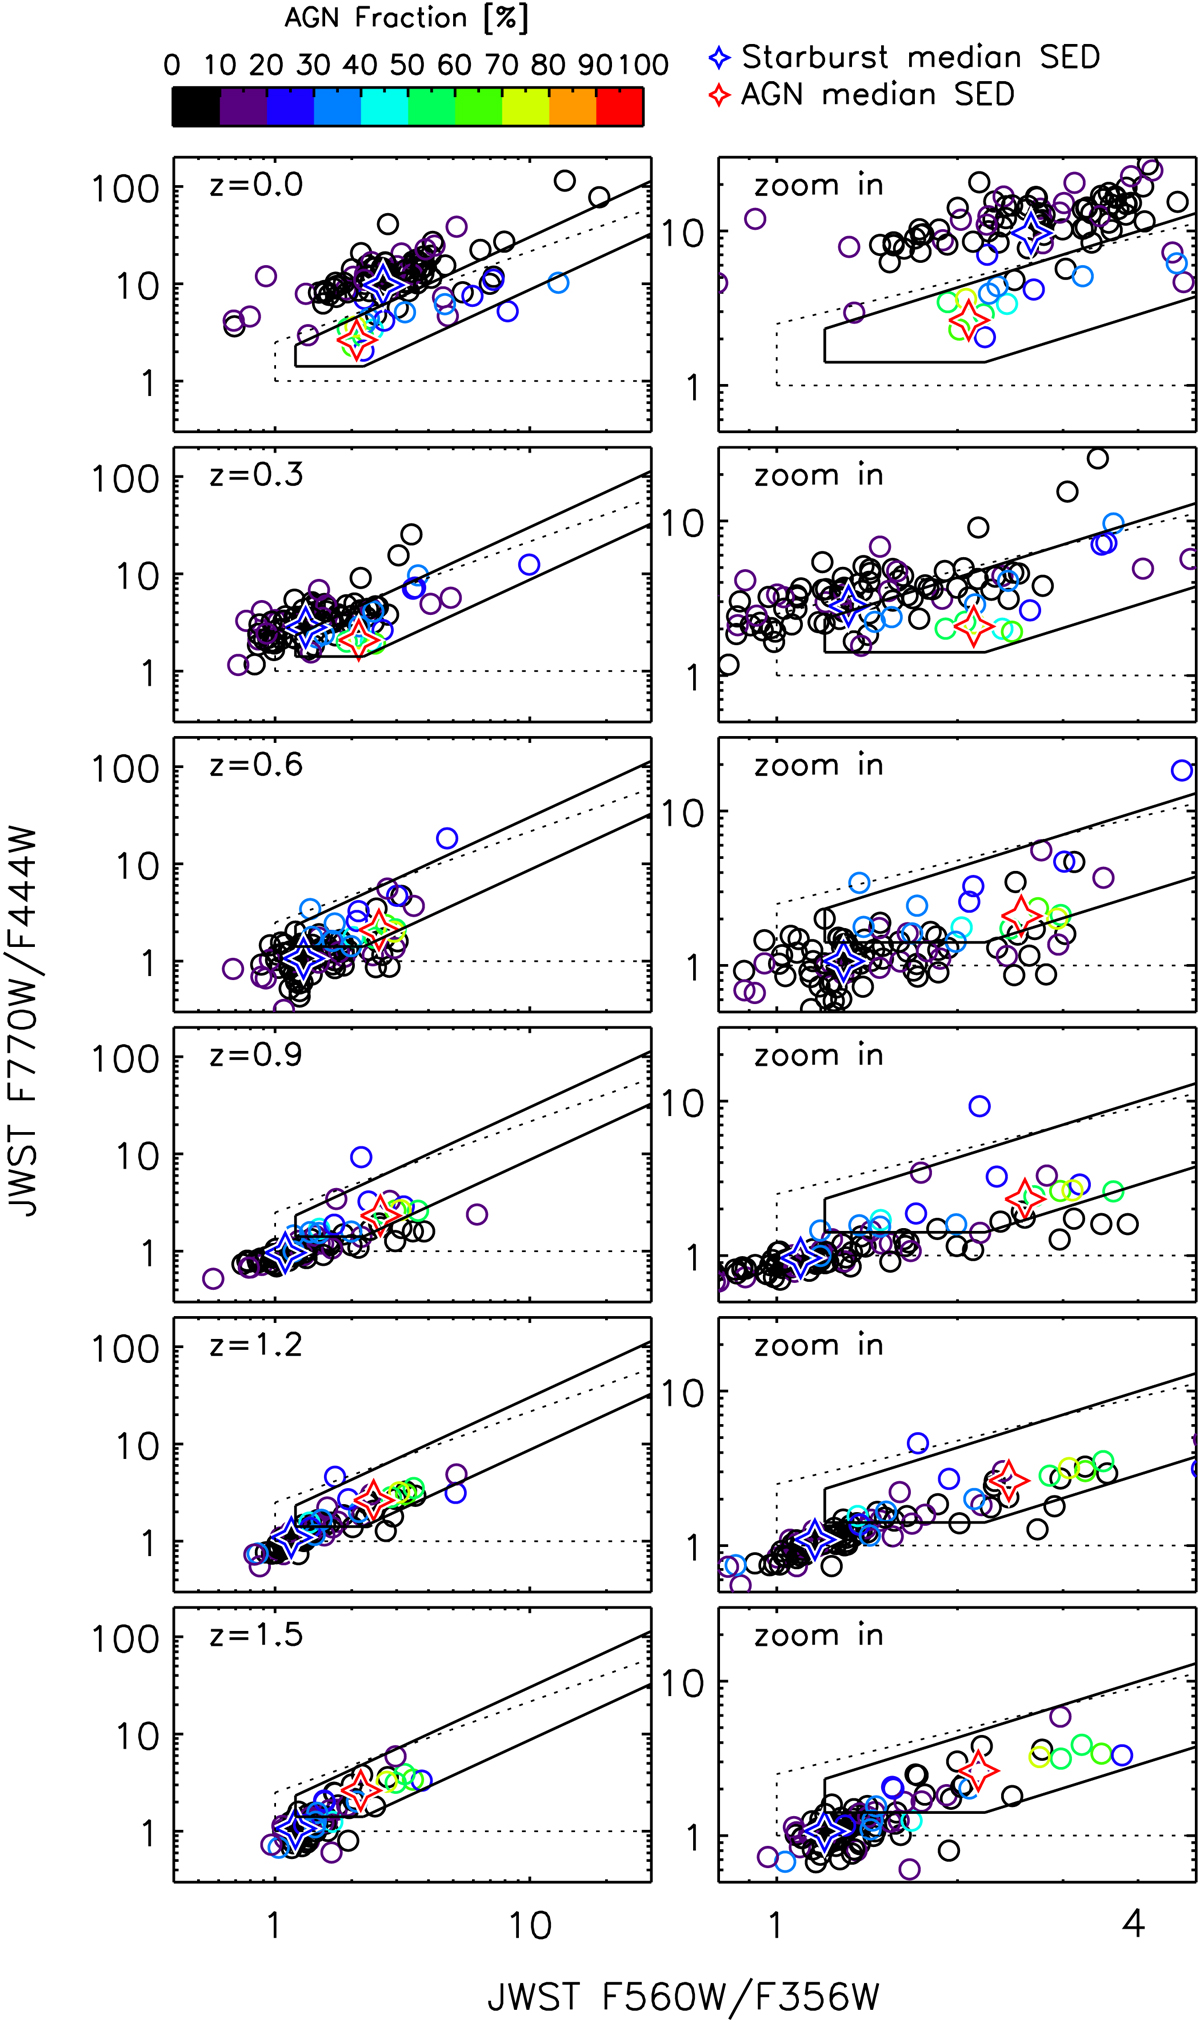
AGN infrared color selection with the JWST filters adopted from Lacy et al. (2004; dotted line) and (Donley et al. 2012; solid line). The circles indicate individual LIRGs with the color coding of the AGN fraction shown at the top of the figure. The blue (starburst) and red (AGN) stars indicate the median SEDs from Fig. 9. The panels show the changes of the galaxy colors with the redshift varying from the top (z = 0.0) to the bottom (z = 1.5) in steps of Δz = 0.3. The left column shows the full range of the galaxy color distribution, while the right column shows a magnified portion of the left plot. The plots are shown only up to z = 1.5 due to the wavelength limit (2MASS J-band) of our SEDs being shifted beyond the coverage of F356W.
Current usage metrics show cumulative count of Article Views (full-text article views including HTML views, PDF and ePub downloads, according to the available data) and Abstracts Views on Vision4Press platform.
Data correspond to usage on the plateform after 2015. The current usage metrics is available 48-96 hours after online publication and is updated daily on week days.
Initial download of the metrics may take a while.